
Page 151 - IJOCTA-15-1
P. 151
Modeling the renewable energy development in T¨urkiye with optimization
5. Results This indicates a reduction of 4.95% in mean MAE
of 45 combinations. The results indicate that
In this section, the results of the cases men- MAEOPT performed better in terms of decreas-
tioned in Section 4 will be presented. Throughout
this section, for the graphs, MLR:MAE refers to ing the MAE. MAE, MAPE and RMSE values for
the best combination for the modeling period, are
the MAE results of MLR while MLR:MeanMAE
also provided in Table 4 for MLR and MAEOPT.
refers to the average of all N C MAEs re-
As seen from the table, MAEOPT provides sig-
lated with MLR. Similarly MAEOPT:MAE
nificant improvement in MAE and MAPE in ex-
refers to the MAE results of MAEOPT while
pense of a slight decrease in RMSE. Moreover,
MAEOPT:MeanMAE refers to the average of all
the MAPE values prove that the developed mod-
N C MAEs related with N C optimization simula-
els are very accurate.
tions (one for each combination). Also, the MAE
results provided in Figures 2, 3, 4 are the ones cal-
5.2. Case 2 results
culated for modeling period (2005-2019), in order
to provide a fair comparison in terms of modeling In this case, three modeling parameters are used.
aspects of two methods. In Figure 3, N:3 indicates that three modeling
parameters have been used. The mean MAE of
120 combinations can also be seen on the figure
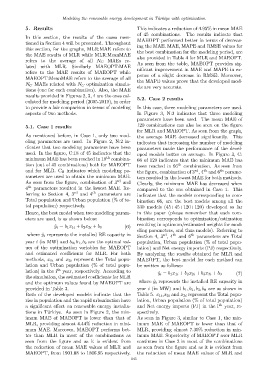
5.1. Case 1 results
for MLR and MAEOPT. As seen from the graph,
As mentioned before, in Case 1, only two mod- the average MAE decreased significantly. This
eling parameters are used. In Figure 2, N:2 in- indicates that increasing the number of modeling
dicates that two modeling parameters have been parameters made the performance of the devel-
used. In the figure, C:18 of 45 indicates that the oped models better on average. In Figure 3, C:
minimum MAE has been reached in 18 th combina- 66 of 120 indicates that the minimum MAE has
tion (out of 45 combinations) both for MAEOPT been reached in 66 th combination. As seen from
and for MLR. C B indicates which modeling pa- the figure, combination of 3 , 4 th and 6 th parame-
rd
rameters are used to obtain the minimum MAE. ters resulted in the lowest MAE for both methods.
As seen from the figure, combination of 3 rd and Clearly, the minimum MAE has decreased when
4 th parameters resulted in the lowest MAE. Re- compared to the one obtained in Case 1. This
ferring to Section 4, 3 rd and 4 th parameters are indicates that the models corresponding to com-
Total population and Urban population (% of to- bination 66, are the best models among all the
tal population) respectively. 330 models (45+45+120+120) developed so far
Hence, the best model when two modeling param- in this paper (please remember that each com-
eters are used, is as shown below: bination corresponds to optimization/estimation
resulting in optimum/estimated weights for mod-
ˆ y i = b 1 x 1i + b 2 x 2i + b 0 (6)
eling parameters, and thus models). Referring to
where ˆy i represents the installed RE capacity in Section 4, 3 , 4 th and 6 th parameters are Total
rd
year i (in MW) and b 0 , b 1 , b 2 are the optimal val- population, Urban population (% of total popu-
ues of the optimization variables for MAEOPT lation) and Net energy imports (PJ) respectively.
and estimated coefficients for MLR. For both By analyzing the results obtained for MLR and
methods, x 1i and x 2i represent the Total popu- MAEOPT, the best model for each method can
lation and Urban population (% of total popu- be written as follows:
lation) in the i th year, respectively. According to
ˆ y i = b 1 x 1i + b 2 x 2i + b 3 x 3i + b 0 (7)
the simulation, the estimated coefficients for MLR
and the optimum values found by MAEOPT are where ˆy i represents the installed RE capacity in
provided in Table 3. year i (in MW) and b 1 , b 2 , b 3 , b 0 are as shown in
Both of the developed models indicate that the Table 5. x 1i ,x 2i and x 3i represent the Total popu-
rise in population and the rapid urbanization have lation, Urban population (% of total population)
a significant effect on renewable energy installa- and Net energy imports (PJ) in the i th year, re-
tions in T¨urkiye. As seen in Figure 2, the min- spectively.
imum MAE of MAEOPT is lower than that of As seen in Figure 3, similar to Case 1, the min-
MLR, providing almost 4.44% reduction in mini- imum MAE of MAEOPT is lower than that of
mum MAE. Moreover, MAEOPT performs bet- MLR, providing almost 7.30% reduction in min-
ter than MLR in most of the combinations as imum MAE. Superiority of MAEOPT over MLR
seen from the figure and as it is evident from continues in Case 2 in most of the combinations
the reduction of mean MAE values of MLR and as seen from the figure and as it is evident from
MAEOPT, from 1901.08 to 1806.95 respectively. the reduction of mean MAE values of MLR and
145