
Page 148 - IJOCTA-15-1
P. 148
N. Tekbıyık-Ersoy / IJOCTA, Vol.15, No.1, pp.137-154 (2025)
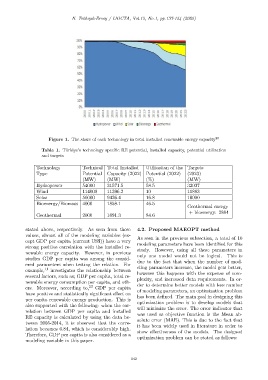
Figure 1. The share of each technology in total installed renewable energy capacity 20
Table 1. T¨urkiye’s technology specific RE potential, installed capacity, potential utilization
and targets
Technology Technical Total Installed Utilization of the Targets
Type Potential Capacity (2022) Potential (2022) (2023)
(MW) (MW) (%) (MW)
Hydropower 54000 31571.5 58.5 32037
Wind 114000 11396.2 10 11883
Solar 56000 9426.4 16.8 10000
Bioenergy/Biomass 4000 1858.1 46.5
Geothermal energy
+ bioenergy: 2884
Geothermal 2000 1691.3 84.6
stated above, respectively. As seen from these 4.2. Proposed MAEOPT method
values, almost all of the modeling variables (ex- As seen in the previous subsection, a total of 10
cept GDP per capita (current US$)) have a very
modeling parameters have been identified for this
strong positive correlation with the installed re-
study. However, using all these parameters in
newable energy capacity. However, in previous
only one model would not be logical. This is
studies GDP per capita was among the consid-
due to the fact that when the number of mod-
ered parameters when testing the relation. For eling parameters increase, the model gets better,
example, 11 investigates the relationship between
however this happens with the expense of com-
several factors, such as; GDP per capita, total re-
plexity, and increased data requirements. In or-
newable energy consumption per capita, and oth- der to determine better models with less number
ers. Moreover, according to, 23 GDP per capita
have positive and statistically significant effect on of modeling parameters, an optimization problem
has been defined. The main goal in designing this
per capita renewable energy production. This is
optimization problem is to develop models that
also supported with the following: when the cor-
will minimize the error. The error indicator that
relation between GDP per capita and installed
was used as objective function is the Mean ab-
RE capacity is calculated by using the data be-
solute error (MAE). This is due to the fact that
tween 2005-2014, it is observed that the corre-
it has been widely used in literature in order to
lation becomes 0.84, which is considerably high.
show effectiveness of the models. The designed
Therefore, GDP per capita is also considered as a
optimization problem can be stated as follows:
modeling variable in this paper.
142