
Page 153 - IJOCTA-15-1
P. 153
Modeling the renewable energy development in T¨urkiye with optimization
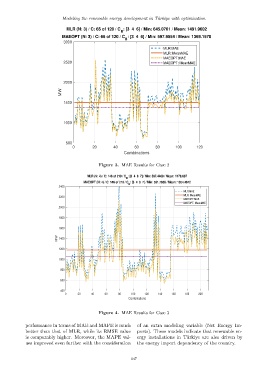
MLR (N: 3) / C: 66 of 120 / C : [3 4 6] / Min: 645.0701 / Mean: 1491.9602
B
MAEOPT (N: 3) / C: 66 of 120 / C : [3 4 6] / Min: 597.9554 / Mean: 1369.1578
B
3000
MLR:MAE
MLR: MeanMAE
MAEOPT:MAE
2500 MAEOPT: MeanMAE
2000
MW
1500
1000
500
0 20 40 60 80 100 120
Combinations
Figure 3. MAE Results for Case 2
MLR (N: 4) / C: 146 of 210 / C : [3 4 6 7] / Min: 597.4468 / Mean: 1178.807
B
MAEOPT (N: 4) / C: 146 of 210 / C : [3 4 6 7] / Min: 531.7638 / Mean: 1054.4672
B
2400
MLR:MAE
MLR: MeanMAE
2200
MAEOPT:MAE
MAEOPT: MeanMAE
2000
1800
1600
MW 1400
1200
1000
800
600
400
0 20 40 60 80 100 120 140 160 180 200
Combinations
Figure 4. MAE Results for Case 3
performance in terms of MAE and MAPE is much of an extra modeling variable (Net Energy Im-
better than that of MLR, while its RMSE value ports). These models indicate that renewable en-
is comparably higher. Moreover, the MAPE val- ergy installations in T¨urkiye are also driven by
ues improved even further with the consideration the energy import dependency of the country.
147