
Page 198 - IJOCTA-15-1
P. 198
H.H. Yildirim, A. Akusta / IJOCTA, Vol.15, No.1, pp.183-201 (2025)
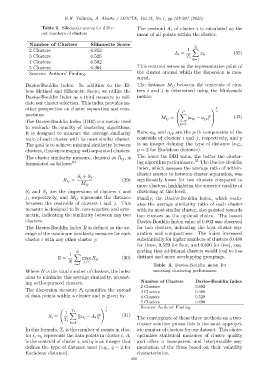
Table 2. Silhouette scores for differ- The centroid A i of cluster i is calculated as the
ent numbers of clusters mean of all points within the cluster:
Number of Clusters Silhouette Score
T i
2 Clusters 0.853 A i = 1 X (32)
3 Clusters 0.526 T i x k
k=1
4 Clusters 0.502
5 Clusters 0.364 This centroid serves as the representative point of
Sources: Authors’ Finding. the cluster around which the dispersion is mea-
sured.
Davies-Bouldin Index: In addition to the El- The distance M ij between the centroids of clus-
bow Method and Silhouette Score, we utilize the ters i and j is determined using the Minkowski
Davies-Bouldin Index as a third measure to vali- metric:
date our cluster selection. This index provides an-
other perspective on cluster separation and com- 1
P p
pactness. X p
M ij = |a ip − a jp | (33)
The Davies-Bouldin Index (DBI) is a metric used
p=1
to evaluate the quality of clustering algorithms.
It is designed to measure the average similarity Here, a ip and a jp are the p-th components of the
ratio of each cluster with its most similar cluster. centroids of clusters i and j, respectively, and p
The goal is to achieve minimal similarity between is an integer defining the type of distance (e.g.,
clusters, thus encouraging well-separated clusters. p = 2 for Euclidean distance).
The cluster similarity measure, denoted as R ij , is The lower the DBI value, the better the cluster-
formulated as follows: 54 ing algorithm performance. 55 The Davies-Bouldin
index, which assesses the average ratio of within-
cluster scatter to between-cluster separation, was
S i + S j
R ij = (29) significantly lower for two clusters compared to
M ij
more clusters, highlighting the superior quality of
S i and S j are the dispersions of clusters i and clustering at this level.
j, respectively, and M ij represents the distance Finally, the Davies-Bouldin Index, which evalu-
between the centroids of clusters i and j. This ates the average similarity ratio of each cluster
measure is designed to be non-negative and sym- with its most similar cluster, also pointed towards
metric, indicating the similarity between any two two clusters as the optimal choice. The lowest
clusters. Davies-Bouldin Index value of 0.092 was observed
The Davies-Bouldin Index R is defined as the av- for two clusters, indicating the best cluster sep-
erage of the maximum similarity measure for each aration and compactness. The index increased
cluster i with any other cluster j: substantially for higher numbers of clusters (0.488
for three, 0.529 for four, and 0.690 for five), sug-
N gesting that additional clusters would lead to less
1 X
R = max R ij (30) distinct and more overlapping groupings.
N j̸=i
i=1 Table 3. Davies-Bouldin index for
Where N is the total number of clusters, the index assessing clustering performance
aims to minimize this average similarity, promot-
Number of Clusters Davies-Bouldin Index
ing well-separated clusters.
2 Clusters 0.092
The dispersion measure S i quantifies the spread
3 Clusters 0.488
of data points within a cluster and is given by: 4 Clusters 0.529
5 Clusters 0.690
! 1 Sources: Authors’ Finding.
T i q
1 X q
S i = ∥x k − A i ∥ (31) The convergence of these three methods on a two-
T i
k=1 cluster solution proves this is the most appropri-
In this formula, T i is the number of points in clus- ate number of clusters for our dataset. This choice
ter i, x k represents the data points in cluster i, A i optimizes statistical measures of cluster quality
is the centroid of cluster i, and q is an integer that and offers a transparent and interpretable seg-
defines the type of distance used (e.g., q = 2 for mentation of the firms based on their volatility
Euclidean distance). characteristics.
192