Page 201 - IJOCTA-15-1
P. 201

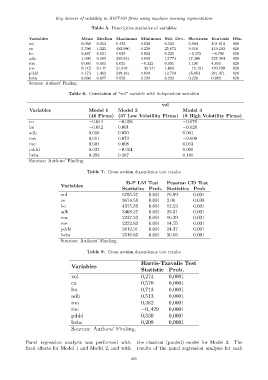
Key drivers of volatility in BIST100 firms using machine learning segmentation
                                          Table 5. Descriptive statistics of variables

              Variables              Mean Median Maximum Minimum Std. Dev. Skewness Kurtosis Obs.
              vol                    0.056  0.052    0.432      0.020     0.022      6.684     104.813  828
              co                     5.396  1.525    402.990    0.238     25.072     9.916     119.203  828
              bo                     0.487  0.511    1.039      0.003     0.239      −0.275    −0.790   828
              adh                    1.090  0.069    290.941    0.000     13.774     17.366    327.384  828
              roa                    0.080  0.065    0.635      −0.323    0.095      1.190     4.859    828
              roe                    0.142  0.147    21.819     −39.741   1.658      −15.151   470.799  828
              pddd                   3.173  1.462    249.481    0.000     12.760     15.853    281.071  828
              beta                   0.830  0.817    1.656      0.234     0.229      0.220     0.063    828
              Sources: Authors’ Finding.

                               Table 6. Correlation of “vol” variable with independent variables
                                                                         vol
              Variables                  Model 1      Model 2                     Model 3
                                         (46 Firms) (37 Low Volatility Firms) (9 High Volatility Firms)
              co                         −0.014       −0.056                      −0.078
              bo                         −0.012       0.061                       −0.028
              adh                       0.016         0.030                       0.061
              roa                        0.011        0.073                       −0.006
              roe                       0.004         0.008                       0.043
              pddd                      0.037         −0.014                      0.000
              beta                       0.293        0.387                       0.180
              Sources: Authors’ Finding.

                                        Table 7. Cross section dependency test results

                                                         B-P LM Test       Pesaran CD Test
                            Variables
                                                       Statistics Prob. Statistics Prob
                            vol                        6705.27     0.001   76.89       0.001
                            co                         3674.58     0.001   2.06        0.038
                            bo                         4375.35     0.001   12.53       0.001
                            adh                        3468.27     0.001   29.31       0.001
                            roa                        2237.23     0.001   10.29       0.001
                            roe                        2322.83     0.001   14.75       0.001
                            pddd                       2812.91     0.001   24.37       0.001
                            beta                       2316.85     0.001   30.65       0.001
                            Sources: Authors’ Finding.

                                        Table 8. Cross section dependency test results

                                                                Harris-Tzavalis Test
                                 Variables
                                                                Statistic Prob.
                                 vol                            0,274       0,0001
                                 co                             0,570       0,0001
                                 bo                             0,743       0,0001
                                 adh                            0,513       0,0001
                                 roa                            0,382       0,0001
                                 roe                            −0, 429     0,0001
                                 pddd                           0,530       0,0001
                                 beta                           0,209       0,0001
                                 Sources: Authors’ Finding.


            Panel regression analysis was performed with      the classical (pooled) model for Model 3. The
            fixed effects for Model 1 and Model 2, and with   results of the panel regression analysis for each

                                                           195
   196   197   198   199   200   201   202   203   204   205   206