
Page 203 - IJOCTA-15-1
P. 203
Key drivers of volatility in BIST100 firms using machine learning segmentation
Table 10. Regression analysis assumption results
Assumptions Model 1 Model 2 Model 3
Wald test Wald test Breusch–Pagan/Cook–Weisberg
heteroscedasticity chi2 (46) = 318.37 chi2 (37) = 102.39 chi2(1) = 2.17
Prob>chi2 = 0.0001 Prob>chi2 = 0.0001 Prob>chi2 = 0.1405
Durbin–Watson = 1.11 Durbin–Watson = 1.14 Durbin–Watson = 1.91
Autocorrelation
Baltagi–Wu LBI = 1.65 Baltagi–Wu LBI = 1.34
Pesaran’s test = 71.69 Pesaran’s test = 61.23
Prob = 0.0001 Prob = 0.0001
Multi-collinearity
Friedman’s test = 431.56 Friedman’s test = 267.73
Prob = 0.0001 Prob = 0.0001
Sources: Authors’ Finding.
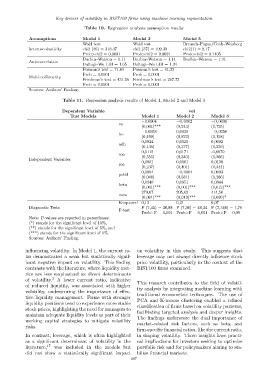
Table 11. Regression analysis results of Model 1, Model 2 and Model 3
Dependent Variable vol
Test Models Model 1 Model 2 Model 3
−0.0004 −0, 0002 −0, 0001
co
(0,001)*** (0,243) (0,735)
−0.0058 0,0020 −0, 0256
bo
(0,499) (0,822) (0,158)
0,0024 0,0020 0,0092
adh
(0,136) (0,377) (0,239)
0,0115 0,0171 -0,0670
roa (0,555) (0,340) (0,266)
Independent Variables 0,0001 0,0001 0,0138
roe
(0,237) (0,401) (0,344)
0,0004 −0, 0004 0,0003
pddd
(0,048) (0,581) (0,266)
0,0340 0,0351 0,0344
beta
(0,001)*** (0,001)*** (0,012)***
270,67 205,62 414,50
cons
(0,001)*** (0,013)*** (0,009)*
R-squared 0,13 0,21 0,07
Diagnostic Tests F (7,45) = 36,88 F (7,36) = 49,34 F (7,146) = 1,76
F-test
Prob>F = 0,001 Prob>F = 0,001 Prob>F = 0,09
Note: P-values are reported in parentheses.
(*) stands for the significant level of 10%,
(**) stands for the significant level of 5%, and
(***) stands for the significant level of 1%.
Sources: Authors’ Finding.
influencing volatility. In Model 1, the current ra- on volatility in this study. This suggests that
tio demonstrated a weak but statistically signif- leverage may not always directly influence stock
icant negative impact on volatility. This finding price volatility, particularly in the context of the
contrasts with the literature, where liquidity met- BIST100 firms examined.
rics are less emphasized as direct determinants
2
of volatility. A lower current ratio, indicative
This research contributes to the field of volatil-
of reduced liquidity, was associated with higher
ity analysis by integrating machine learning with
volatility, underscoring the importance of effec-
traditional econometric techniques. The use of
tive liquidity management. Firms with stronger PCA and K-means clustering enabled a refined
liquidity positions tend to experience more stable
stock prices, highlighting the need for managers to classification of firms based on volatility patterns,
maintain adequate liquidity levels as part of their facilitating targeted analysis and deeper insights.
The findings underscore the dual importance of
working capital strategies to mitigate volatility
market-related risk factors, such as beta, and
risks.
firm-specific financial ratios, like the current ratio,
In contrast, leverage, which is often highlighted in shaping volatility. These insights have practi-
as a significant determinant of volatility in the cal implications for investors seeking to optimize
literature, 17 was included in the models but portfolio risk and for policymakers aiming to sta-
did not show a statistically significant impact bilize financial markets.
197