
Page 202 - IJOCTA-15-1
P. 202
H.H. Yildirim, A. Akusta / IJOCTA, Vol.15, No.1, pp.183-201 (2025)
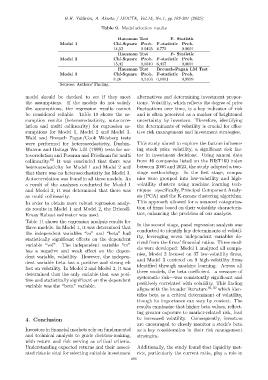
Table 9. Model selection results
Hausman Test F- Statistic
Model 1 Chi-Square Prob. F-statistic Prob.
14,53 0.0425 4.772 0.0001
Hausman Test F- Statistic
Model 2 Chi-Square Prob. F-statistic Prob.
15,42 0,0310 6,437 0,0001
Hausman Test Breusch-Pagan LM Test
Model 3 Chi-Square Prob. F-statistic Prob.
8.26 0,3103 0,0001 0,9999
Sources: Authors’ Finding.
model should be checked to see if they meet alternatives and determining investment propor-
the assumptions. If the models do not satisfy tions. Volatility, which reflects the degree of price
the assumptions, the regression results cannot fluctuations over time, is a key indicator of risk
be considered reliable. Table 10 shows the as- and is often perceived as a marker of heightened
sumption results (heteroscedasticity, autocorre- uncertainty by investors. Therefore, identifying
lation and multi collinearity) for regression as- the determinants of volatility is crucial for effec-
sumptions for Model 1, Model 2 and Model 3. tive risk management and investment strategies.
Wald and Breusch–Pagan/Cook–Weisberg tests
were performed for heteroscedasticity, Durbin- This study aimed to explore the factors influenc-
Watson and Baltagi Wu LBI (1999) tests for au- ing stock price volatility, a significant risk fac-
tocorrelation and Pesaran and Friedman for multi tor in investment decisions. Using annual data
collinearity. 61 It was concluded that there was from 46 companies listed on the BIST100 index
heteroscedasticity for Model 1 and Model 2 and between 2006 and 2023, the study adopted a two-
that there was no heteroscedasticity for Model 3. stage methodology. In the first stage, compa-
Autocorrelation was found in all three models. As nies were grouped into low-volatility and high-
a result of the analyses conducted for Model 1 volatility clusters using machine learning tech-
and Model 2, it was determined that there was niques—specifically, Principal Component Analy-
an multi collinearity. sis (PCA) and the K-means clustering algorithm.
In order to obtain more robust regression analy- This approach allowed for a nuanced categoriza-
sis results in Model 1 and Model 2, the Driscoll- tion of firms based on their volatility characteris-
Kraay Robust estimator was used. tics, enhancing the precision of our analysis.
Table 11 shows the regression analysis results for
In the second stage, panel regression analysis was
three models. In Model 1, it was determined that
conducted to identify key determinants of volatil-
the independent variables “co” and “beta” had ity, leveraging seven independent variables de-
statistically significant effects on the dependent
variable “vol”. The independent variable “co” rived from the firms’ financial ratios. Three mod-
has a negative and weak effect on the depen- els were developed: Model 1 analyzed all compa-
dent variable, volatility. However, the indepen- nies, Model 2 focused on 37 low-volatility firms,
dent variable beta has a positive and strong ef- and Model 3 centered on 9 high-volatility firms
fect on volatility. In Model 2 and Model 3, it was identified through machine learning. Across all
determined that the only variable that was posi- three models, the beta coefficient—a measure of
tive and statistically significant on the dependent systematic risk—was consistently significant and
variable was the “beta” variable. positively correlated with volatility. This finding
aligns with the broader literature 16,39 which iden-
tifies beta as a critical determinant of volatility,
though its importance can vary by context. The
results emphasize that higher beta values, reflect-
ing greater exposure to market-related risk, lead
4. Conclusion to increased volatility. Consequently, investors
are encouraged to closely monitor a stock’s beta
Investors in financial markets rely on fundamental as a key consideration in their risk management
and technical analysis to guide decision-making, strategies.
with return and risk serving as critical criteria.
Understanding expected returns and their associ- Additionally, the study found that liquidity met-
ated risks is vital for selecting suitable investment rics, particularly the current ratio, play a role in
196