
Page 199 - IJOCTA-15-1
P. 199
Key drivers of volatility in BIST100 firms using machine learning segmentation
Having established the optimal number of clus-
ters, we now analyze the resulting cluster charac-
teristics and their implications for understanding
volatility patterns among BIST100 firms.
3.5.3. Cluster analysis results
Applying our clustering methodology to the PCA-
transformed volatility data yielded insightful re-
sults, revealing distinct groups of firms with simi-
lar volatility characteristics. The clustering anal-
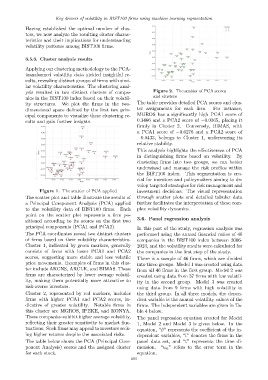
ysis resulted in two distinct clusters of compa- Figure 2. The scatter of PCA scores
nies in the BIST100 index based on their volatil- and clusters
ity structures. We plot the firms in the two- The table provides detailed PCA scores and clus-
dimensional space defined by the first two prin- ter assignments for each firm. For instance,
cipal components to visualize these clustering re- MGROS has a significantly high PCA1 score of
sults and gain further insights. 0.3466 and a PCA2 score of −0.0365, placing it
firmly in Cluster 2. Conversely, BIMAS, with
a PCA1 score of −0.0276 and a PCA2 score of
−0.0433, belongs to Cluster 1, underscoring its
relative stability.
This analysis highlights the effectiveness of PCA
in distinguishing firms based on volatility. By
clustering firms into two groups, we can better
understand and manage the risk profiles within
the BIST100 index. This segmentation is cru-
cial for investors and policymakers aiming to de-
velop targeted strategies for risk management and
Figure 1. The scatter of PCA applied investment decisions. The visual representation
The scatter plot and table illustrate the results of through scatter plots and detailed tabular data
a Principal Component Analysis (PCA) applied further facilitates the interpretation of these com-
to the volatility data of BIST100 firms. Each plex volatility dynamics.
point on the scatter plot represents a firm po-
sitioned according to its scores on the first two 3.6. Panel regression analysis
principal components (PCA1 and PCA2). In this part of the study, regression analysis was
The PCA coordinates reveal two distinct clusters performed using the annual financial ratios of 46
of firms based on their volatility characteristics. companies in the BIST100 index between 2006-
Cluster 1, indicated by green markers, generally 2023, and the volatility results were calculated for
consists of firms with lower PCA1 and PCA2 the companies in the first step of the study.
scores, suggesting more stable and less volatile There is a sample of 46 firms, which are divided
price movements. Examples of firms in this clus- into three groups. Model 1 was created using data
ter include AKCNS, ARCLK, and BIMAS. These from all 46 firms in the first group. Model 2 was
firms are characterized by lower average volatil- created using data from 37 firms with low volatil-
ity, making them potentially more attractive to ity in the second group. Model 3 was created
risk-averse investors. using data from 9 firms with high volatility in
Cluster 2, represented by red markers, includes the third group. In all three models, the depen-
firms with higher PCA1 and PCA2 scores, in- dent variable is the annual volatility values of the
dicative of greater volatility. Notable firms in firms. The independent variables are given in Ta-
this cluster are MGROS, IPEKE, and KONYA. ble 4 below.
These companies exhibit higher average volatility, The panel regression equation created for Model
reflecting their greater sensitivity to market fluc- 1, Model 2 and Model 3 is given below. In the
tuations. Such firms may appeal to investors seek- equation, “β” represents the coefficient of the in-
ing higher returns despite the associated risks. dependent variables, “i” denotes the firms in the
The table below shows the PCA (Principal Com- panel data set, and “t” represents the time di-
ponent Analysis) scores and the assigned cluster mension. “u it ” refers to the error term in the
for each stock. equation.
193