
Page 50 - IJOCTA-15-1
P. 50
L.K. Yadav et.al. / IJOCTA, Vol.15, No.1, pp.35-49 (2025)
−0.119922 −0.005605
−0.005606
−0.119923
−0.005606
−0.119924
−0.005606
−0.119925
−0.005606
−0.005606
−0.119926
ð=0.50ð=0.50
ð=0.50
−0.005607
ð=0.50ð=0.50
ð=0.75ð=0.75
−0.119927 ð=0.75 ð=0.50
ð=0.75ð=0.75
ð=1.00ð=1.00
ð=1.00 −0.005607 ð=0.75
−0.119928 ð=1.00
ð=1.00ð=1.00
−0.005607
−0.119929 −0.005607
−2 −1.8 −1.6 −1.4 −1.2 −1 −0.8 −0.6 −0.4 −0.2 0 −2 −1.8 −1.6 −1.4 −1.2 −1 −0.8 −0.6 −0.4 −0.2 0
(a) (b)
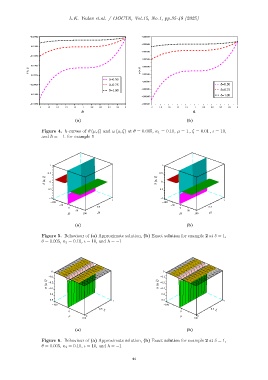
Figure 4. ℏ curves of ϑ (µ, ξ) and ω (µ, ξ) at θ = 0.005, κ 1 = 0.10, µ = 1 , ξ = 0.01 , ι = 10,
and ℏ = −1. for example 1
1 1
0.5 0.5
0 0
−0.5 −0.5
−1 −1
1 1
−100 −100
−50 −50
0 0.5 0 0.5
50 50
1000 1000
(a) (b)
Figure 5. Behaviour of (a) Approximate solution, (b) Exact solution for example 2 at δ = 1,
θ = 0.005, κ 1 = 0.10, ι = 10, and ℏ = −1
0 0
−0.1 −0.1
−0.2 −0.2
−0.3 −0.3
−0.4 −0.4
−0.5 1 −0.5 1
−100 −100
0.5 0.5
0 0
0 0
100 100
(a) (b)
Figure 6. Behaviour of (a) Approximate solution, (b) Exact solution for example 2 at δ = 1,
θ = 0.005, κ 1 = 0.10, ι = 10, and ℏ = −1
44