
Page 112 - IJOCTA-15-2
P. 112
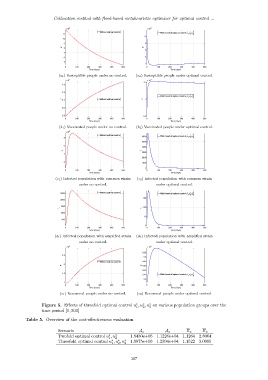
Collocation method with flood-based metaheuristic optimizer for optimal control ...
10 6 10 6
*
*
Without optimal control With threefold optimal control u ,u ,u *
11 1 2 3
10
10
9 8
S 8 S
6
7
6 4
5
2
0 100 200 300 400 500 0 100 200 300 400 500
Time (days) Time (days)
(a 1 ) Susceptible people under no control. (a 2 ) Susceptible people under optimal control.
10 7 10 7
3.5
2.9
2.8
*
*
With threefold optimal control u ,u ,u *
1 2 3
V Without optimal control V 3
2.7
2.6
2.5
2.5
0 100 200 300 400 500 0 100 200 300 400 500
Time (days) Time (days)
(b 1 ) Vaccinated people under no control. (b 2 ) Vaccinated people under optimal control.
4
10
*
*
Without optimal control 6000 With threefold optimal control u ,u ,u *
8 1 2 3
5000
6
4000
I c I c
3000
4
2000
2
1000
0
0 100 200 300 400 500 0 100 200 300 400 500
Time (days) Time (days)
(c 1 ) Infected population with common strain (c 2 ) Infected population with common strain
under no control. under optimal control.
*
*
2500 Without optimal control With threefold optimal control u ,u ,u *
1 2 3
150
2000
1500 100
I v I v
1000
50
500
0
0 100 200 300 400 500 0 100 200 300 400 500
Time (days) Time (days)
(d 1 ) Infected population with amplified strain (d 2 ) Infected population with amplified strain
under no control. under optimal control.
10 6 10 5
9.52
2.5
9.5
Without optimal control 9.48
2
R R 9.46
9.44
1.5 * * *
9.42 With threefold optimal control u ,u ,u 3
1
2
9.4
1
0 100 200 300 400 500 0 100 200 300 400 500
Time (days) Time (days)
(e 1 ) Recovered people under no control. (e 2 ) Recovered people under optimal control.
∗
∗
∗
Figure 5. Effects of threefold optimal control u , u , u on various population groups over the
2
1
3
time period [0, 500]
Table 5. Overview of the cost-effectiveness evaluation
Scenario A c A v E c E v
∗
Twofold optimal control u , u ∗ 1.9430e+06 1.1226e+04 1.1264 2.8064
1 2
∗
∗
Threefold optimal control u , u , u ∗ 1.9875e+06 1.2394e+04 1.1522 3.0985
1 2 3
307