
Page 111 - IJOCTA-15-2
P. 111
A. Ebrahimzadeh, R. Khanduzi, A. Jajarmi / IJOCTA, Vol.15, No.2, pp.294-310 (2025)
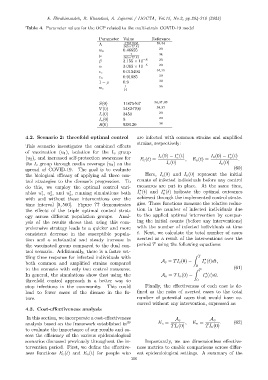
Table 4. Parameter values for the OCP related to the multi-strain COVID-19 model
Parameter Value Reference
Λ 37641835 33,34
365×77.43
w v 0.46655 20
µ 1 34
365×77.43
β 3.155 × 10 −8 20
α 3.063 × 10 −5 20
c c 0.015494 34,35
0.91685 20
c v
1 − ρ 0.9 20
1 36
w c
14
S(0) 11875467 34,37,38
V (0) 24824790 34,37
I c (0) 3450 20
I v (0) 8 20
R(0) 938120 38
4.2. Scenario 2: threefold optimal control are infected with common strains and amplified
strains, respectively:
This scenario investigates the combined effects
of vaccination (u 1 ), isolation for the I v group ∗ ∗
I c (0) − I (t) I v (0) − I (t)
(u 2 ), and increased self-protection awareness for E c (t) = c , E v (t) = v .
the I c group through media coverage (u 3 ) on the I c (0) I v (0)
spread of COVID-19. The goal is to evaluate (60)
the biological efficacy of applying all three con- Here, I c (0) and I v (0) represent the initial
trol strategies to the disease’s progression. To counts of infected individuals before any control
do this, we employ the optimal control vari- measures are put in place. At the same time,
∗
∗
∗
∗
∗
ables u , u , and u , running simulations both I (t) and I (t) indicate the optimal outcomes
v
c
3
1
2
with and without these interventions over the achieved through the implemented control strate-
time interval [0, 500]. Figure ?? demonstrates gies. These functions measure the relative reduc-
the effects of the triple optimal control strat- tion in the number of infected individuals due
egy across different population groups. Anal- to the applied optimal intervention by compar-
ysis of the results shows that using this com- ing the initial counts (before any interventions)
prehensive strategy leads to a quicker and more with the number of infected individuals at time
consistent decrease in the susceptible popula- t. Next, we calculate the total number of cases
tion and a substantial and steady increase in averted as a result of the interventions over the
the vaccinated group compared to the dual con- period T using the following equations:
trol scenario. Additionally, there is a faster set-
tling time response for infected individuals with Z T
∗
A c = TI c (0) − I (t)dt,
both common and amplified strains compared c
0
to the scenario with only two control measures. Z T (61)
∗
In general, the simulations show that using the A v = TI v (0) − I (t)dt.
v
threefold control approach is a better way to 0
stop infections in the community. This could Finally, the effectiveness of each case is de-
lead to fewer cases of the disease in the fu- fined as the ratio of averted cases to the total
ture. number of potential cases that would have oc-
curred without any intervention, expressed as:
4.3. Cost-effectiveness analysis
In this section, we incorporate a cost-effectiveness A c A v
analysis based on the framework established in 39 E c = , E v = . (62)
TI c (0) TI v (0)
to evaluate the importance of our results and as-
sess the efficiency of the various epidemiological
scenarios discussed previously throughout the in- Importantly, we use dimensionless effective-
tervention period. First, we define the effective- ness metrics to enable comparisons across differ-
ness functions E c (t) and E v (t) for people who ent epidemiological settings. A summary of the
306