
Page 130 - IJOCTA-15-2
P. 130
Parallel late acceptance hill-climbing for binary-encoded optimization problems
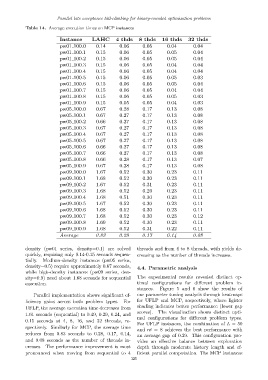
Table 14. Average execution times on MCP instances
Instance LAHC 4 thds 8 thds 16 thds 32 thds
pw01 100.0 0.14 0.06 0.05 0.04 0.04
pw01 100.1 0.15 0.06 0.05 0.05 0.04
pw01 100.2 0.15 0.06 0.05 0.05 0.04
pw01 100.3 0.15 0.06 0.05 0.04 0.04
pw01 100.4 0.15 0.06 0.05 0.04 0.04
pw01 100.5 0.15 0.06 0.05 0.05 0.03
pw01 100.6 0.15 0.06 0.05 0.05 0.04
pw01 100.7 0.15 0.06 0.05 0.04 0.04
pw01 100.8 0.15 0.06 0.05 0.05 0.03
pw01 100.9 0.15 0.05 0.05 0.04 0.03
pw05 100.0 0.67 0.28 0.17 0.13 0.08
pw05 100.1 0.67 0.27 0.17 0.13 0.08
pw05 100.2 0.66 0.27 0.17 0.13 0.08
pw05 100.3 0.67 0.27 0.17 0.13 0.08
pw05 100.4 0.67 0.27 0.17 0.13 0.08
pw05 100.5 0.67 0.27 0.17 0.13 0.08
pw05 100.6 0.66 0.27 0.17 0.13 0.08
pw05 100.7 0.66 0.27 0.17 0.13 0.08
pw05 100.8 0.66 0.28 0.17 0.13 0.07
pw05 100.9 0.67 0.28 0.17 0.13 0.08
pw09 100.0 1.67 0.52 0.30 0.23 0.11
pw09 100.1 1.68 0.52 0.30 0.23 0.11
pw09 100.2 1.67 0.52 0.31 0.23 0.11
pw09 100.3 1.68 0.52 0.29 0.23 0.11
pw09 100.4 1.68 0.51 0.30 0.23 0.11
pw09 100.5 1.67 0.52 0.30 0.23 0.11
pw09 100.6 1.68 0.52 0.30 0.23 0.11
pw09 100.7 1.68 0.52 0.30 0.23 0.12
pw09 100.8 1.69 0.52 0.30 0.23 0.11
pw09 100.9 1.68 0.52 0.31 0.22 0.11
Average 0.83 0.28 0.17 0.14 0.08
density (pw01 series, density=0.1) are solved threads and from 4 to 8 threads, with yields de-
quickly, requiring only 0.14-0.15 seconds sequen- creasing as the number of threads increases.
tially. Medium-density instances (pw05 series,
density=0.5) require approximately 0.67 seconds, 4.4. Parametric analysis
while high-density instances (pw09 series, den-
sity=0.9) need about 1.68 seconds for sequential The experimental results revealed distinct op-
execution. timal configurations for different problem in-
stances. Figure 5 and 6 show the results of
Parallel implementation shows significant ef- our parameter tuning analysis through heatmaps
ficiency gains across both problem types. For for UFLP and MCP, respectively, where lighter
UFLP, the average execution time decreases from shading indicates better performance (lower gap
scores). The visualization shows distinct opti-
1.61 seconds (sequential) to 0.49, 0.29, 0.24, and
mal configurations for different problem types.
0.15 seconds at 4, 8, 16, and 32 threads, re-
For UFLP instances, the combination of L = 50
spectively. Similarly for MCP, the average time
and nt = 8 achieves the best performance with
reduces from 0.83 seconds to 0.28, 0.17, 0.14,
an average gap of 0.29. This configuration pro-
and 0.08 seconds as the number of threads in- vides an effective balance between exploration
creases. The performance improvement is most depth through moderate history length and ef-
pronounced when moving from sequential to 4 ficient parallel computation. The MCP instances
325