Page 63 - IJOCTA-15-2
P. 63

¨
                               D. Balpınarlı, M. Onal / IJOCTA, Vol.15, No.2, pp.245-263 (2025)
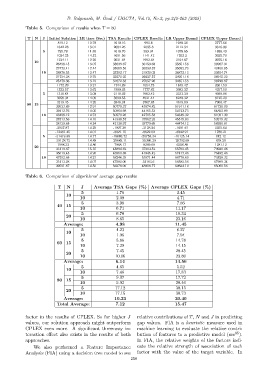
            Table 5. Comparison of results when T = 80

             T   N  J  Initial Solution LR time (Sec) TSA Results CPLEX Results LR Upper Bound CPLEX Upper Bound
                           819.12       12.78       1010.16      993.8         1048.38           2777.68
                          1642.23       13.01       2084.26      2035.3        2112.34           3316.08
                    5      735.78       11.89       1018.76      989.34        1078.65           1880.43
                          1034.25       14.32       1091.56     1141.42         1203.3           2035.70
                          1234.11       12.20       2031.84     1992.64        2104.67           3076.16
                10
                          26498.15      13.07      33639.67     30153.63       35651.56         38967.31
                          27473.41      12.44      33069.59     30233.37       35682.73         40100.85
                    10    28876.53      13.47      33293.17     31920.03       36873.13         39354.74
                          21734.28      12.70      32572.25     26637.57       34951.16         38915.22
                          25478.36      13.19      31672.33     27057.26       34351.53         38228.97
                          1172.39       13.21       1744.89     1554.73        1849.42           3301.53
                          1323.57       13.62       1980.03     1777.82        2082.32           4257.50
                    5     1318.64       13.08       2118.02     1902.42        2333.39           4098.88
                          3956.34       14.09       5690.55     4921.44        6240.32           8125.20
                          3219.45       14.20       3846.01     3767.85        4619.89           7906.47
             80 15
                          39523.89      12.91      50779.37     43574.82       51911.18         61730.09
                          39412.76      14.05      50864.98     44165.53       54123.73         64802.89
                    10    43498.12      14.73      50570.26     42715.58       54349.32         61091.39
                          28713.56      14.10      41338.57     37862.23       45519.83         59219.32
                          28129.65      14.34      42138.97     39779.69       44474.12         58930.81
                          -2927.87      14.39      -1927.39     -2128.24       -1691.61          2355.64
                          -12481.45     14.01      -8021.15     -8622.02       -6942.91          1786.21
                    5     -31419.38     14.77      -18080.72    -20758.34      -15125.14         812.12
                          -39128.72     14.88      -29685.11    -35360.29      -25792.65         838.29
                          -1998.32      14.86      -7968.17     -8289.68       -6556.89          1281.12
                20
                          31419.67      15.15      45894.62     37203.52       55792.45         70930.48
                          35619.45      14.95      48550.68     41945.42       57417.46         76482.46
                    10    43792.65      14.21      58246.39     53871.44       68778.69         73528.32
                          31413.28      14.07      47582.00     34103.6        58582.56         67999.34
                          39591.87      14.50      56978.06     48918.77       69834.19         85060.56
            Table 6. Comparison of algorithms’ average gap results

                           T   N     J     Average TSA Gaps (%) Average CPLEX Gaps (%)
                                     5               1.76                       3.45
                              10
                                     10              2.09                       4.71
                                     5               3.98                       7.86
                          40 15
                                     10              6.71                      11.17
                                     5               6.70                      18.34
                              20
                                     10              8.65                      23.16
                             Average:               4.98                       11.45
                                     5               4.23                       6.27
                              10
                                     10              1.96                       7.94
                                     5               5.86                      14.78
                          60 15
                                     10              7.29                      14.15
                                     5               7.45                      20.45
                              20
                                     10             10.06                      23.80
                             Average:               6.14                       14.56
                                     5               4.65                       5.52
                              10
                                     10              7.46                      17.83
                                     5               9.07                      17.72
                          80 15
                                     10              5.92                      20.46
                                     5              17.12                      30.15
                              20
                                     10             17.15                      30.73
                             Average:               10.23                      20.40
                          Total Average:            7.12                       15.47

            factor in the results of CPLEX. So for higher J   relative contributions of T, N and J in predicting
            values, our solution approach might outperform    gap values. FIA is a heuristic measure used in
            CPLEX even more. A significant three-way in-      machine learning to evaluate the relative contri-
                                                                                                         85
            teraction effect also exists in the results of both  bution of features to a predictive model (see ).
            approaches.                                       In FIA, the relative weights of the factors indi-
                We also performed a Feature Importance        cate the relative strength of association of each
            Analysis (FIA) using a decision tree model to see  factor with the value of the target variable. In
                                                           258
   58   59   60   61   62   63   64   65   66   67   68