
Page 139 - IJOCTA-15-3
P. 139
A novel ninth-order root-finding algorithm for nonlinear equations with implementations in various ...
5. Polynomiography via the proposed whileimdo
method z n + 1) = I(z n )
(
if|z n + 1) − z n | < then
(
The aim of this section is to represent poly- break
nomiographs generated using our proposed i = i + 1
method as outlined in Equation (9). A poly- colorz 0 bymeansofcolormap
nomiograph is an image produced through the
process of polynomiography, a term coined by
Kalantri in 2005. It is defined as “the art and In iterative algorithms, a stopping criterion
science of visualization in approximation of the is crucial for determining whether the process has
zeros of complex polynomials, via fractal and reached convergence or divergence. This criterion,
non-fractal images created using the mathemati- known as a convergence test, evaluates the algo-
cal convergence properties of iteration functions.” rithm’s progress in finding a solution. The typical
The concept of a “fractal,” introduced by Benoit form of a convergence test is
Mandelbrot, describes a geometric shape in which
each part has the same statistical properties as the |z i+1 − z i | < ε (18)
whole. Although both polynomiographs and frac- where z i+1 and z i are successive points in the
tals can be created using various numerical algo- iteration, and ε > 0 is a predefined accuracy
rithms, they differ significantly in their structural threshold. The convergence test (z i+1 , z i , ε) in-
scale. A “polynomiographer” can systematically dicates TRUE if the method converges to a root
adjust the structure and pattern by applying dif- and FALSE otherwise. In this study, we used this
ferent numerical algorithms to various complex convergence test Equation (18). The color varia-
polynomials. Generally, polynomiographs and tions in the polynomiographs represent the num-
fractals belong to different categories of graphi- ber of iterations needed to approximate the root
cal objects. within the specified accuracy ε. By modifying the
To create polynomiographs over the complex parameter m, which limits the maximum number
plane C, we begin by defining a rectangular re- of iterations, it is possible to generate numerous
gion R with dimensions [−2, 2]×[−2, 2], setting a visually appealing polynomiographs. The explo-
precision threshold of ε = 10 −3 , and an iteration ration of polynomiography and its artistic impli-
limit of m = 15. Each point z 0 within this region cations is covered in references. 45–47
undergoes an iterative process, and the point cor- Here, we present some examples of the fol-
responding to z 0 is colored based on how closely lowing complex polynomials using our developed
the truncated orbit converges to a root or fails to algorithms and compare them with the poly-
converge. The image resolution depends on the nomiographs obtained by using other well-known
discretization of the rectangle R. For example, a two-step iterative methods:
2
3
2000 × 2000 grid results in a high-resolution im- (i) p 1 (z) = z − z − z − 1, Area[−2, 2]
3
4
2
age. The colors in polynomiographs are typically (ii) p 2 (z) = z − z − z − z − 1, Area [-2, 2]
5
3
2
4
linked to the number of iterations required to ap- (iii) p 3 (z) = z − z − z − z − z − 1, Area [-2,
proximate the zeros of the complex polynomial 2]
2
5
6
3
4
to a specified accuracy using a chosen numerical (iv) p 4 (z) = z −z −z −z −z −z −1, Area
algorithm. The fundamental algorithm for gener- [-2, 2]
ating polynomiographs is outlined in Algorithm 1 The colormap used for coloring the iterations
below. in the generation of polynomiographs is presented
in the following figure.
Algorithm 1. Polynomiograph’s generation
Input:
p ∈ C––Polynomial
A ∈ C––Area
m––Maximumnumberofiterations
I––Iterationmethod
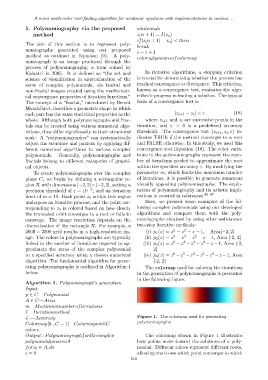
∈ ––Accuracy Figure 1. The colormap used for generating
polynomiographs
Colormap[0...C − 1]––ColormapwithC
colors.
Output : Polynomiographforthecomplex The colormap shown in Figure 1 illustrates
polynomialpinareaA how points move toward the solutions of a poly-
forz 0 ∈ A, do nomial. Different colors represent different roots,
i = 0 allowing one to see which point converges to which
511