
Page 140 - IJOCTA-15-3
P. 140
Srinivasarao Thota et al. / IJOCTA, Vol.15, No.3, pp.503-516 (2025)
solution. Lighter colors indicate that the point
converges quickly, while darker shades denote that
more steps are required. The fuzzy or mixed-color
edges between regions show areas where a small
change can direct a point to a different solution.
This creates an image that is both complex and
beautiful, with patterns that resemble fractals.
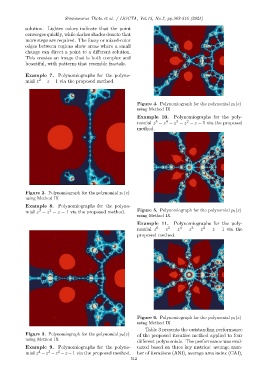
Example 7. Polynomiographs for the polyno-
2
mial z − z − 1 via the proposed method.
Figure 4. Polynomiograph for the polynomial p 3 (z)
using Method IX
Example 10. Polynomiographs for the poly-
4
5
3
2
nomial z − z − z − z − z − 1 via the proposed
method.
Figure 2. Polynomiograph for the polynomial p 1 (z)
using Method IX
Example 8. Polynomiographs for the polyno-
3
2
mial z − z − z − 1 via the proposed method. Figure 5. Polynomiograph for the polynomial p 3 (z)
using Method IX
Example 11. Polynomiographs for the poly-
4
5
3
6
2
nomial z − z − z − z − z − z − 1 via the
proposed method.
Figure 6. Polynomiograph for the polynomial p 4 (z)
using Method IX
Table 3 presents the outstanding performance
Figure 3. Polynomiograph for the polynomial p 2 (z) of the proposed iterative method applied to four
using Method IX
different polynomials. The performance was eval-
Example 9. Polynomiographs for the polyno- uated based on three key metrics: average num-
3
2
4
mial z −z −z −z −1 via the proposed method. ber of iterations (ANI), average area index (CAI),
512