
Page 123 - IJOCTA-15-4
P. 123
Rolling bearing fault diagnosis method based on GJO–VMD, multiscale fuzzy entropy, and GSABO–BP...
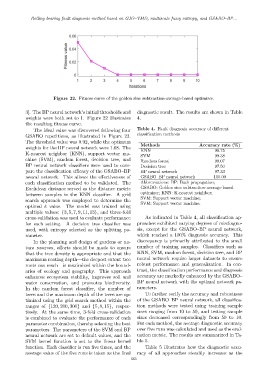
Figure 22. Fitness curve of the golden sine subtraction-average-based optimizer.
3]. The BP neural network’s initial thresholds and diagnostic result. The results are shown in Table
weights were both set to 1. Figure 22 illustrates 4.
the resulting fitness curve.
The ideal value was discovered following four Table 4. Fault diagnosis accuracy of different
classification methods
GSABO repetitions, as illustrated in Figure 22.
The threshold value was 0.92, while the optimum
Methods Accuracy rate (%)
weights for the BP neural network were 1.08. The
KNN 98.75
K-nearest neighbor (KNN), support vector ma-
SVM 99.38
chine (SVM), random forest, decision tree, and Random forest 99.07
BP neural network classifiers were used to com- Decision tree 97.50
pare the classification efficacy of the GSABO–BP BP neural network 97.33
neural network. This allows the effectiveness of GSABO–BP neural network 100.00
each classification method to be validated. The Abbreviations: BP: Back propagation;
Euclidean distance served as the distance metric GSABO: Golden sine subtraction-average-based
optimizer; KNN: K-nearest neighbor;
between samples in the KNN classifier. A grid
SVM: Support vector machine;
search approach was employed to determine the
SVM: Support vector machine.
optimal k value. The model was trained using
multiple values: {3, 5, 7, 9, 11, 13}, and three-fold
cross-validation was used to evaluate performance As indicated in Table 4, all classification ap-
for each setting. A decision tree classifier was proaches exhibited varying degrees of misdiagno-
used, with entropy selected as the splitting pa- sis, except for the GSABO–BP neural network,
rameter. which reached a 100% diagnosis accuracy. This
In the planning and design of gardens or na- discrepancy is primarily attributed to the small
ture reserves, efforts should be made to ensure number of training samples. Classifiers such as
that the tree density is appropriate and that the KNN, SVM, random forest, decision tree, and BP
maximum rooting depth—the deepest extent tree neural network require larger datasets to ensure
roots can reach—is maximized within the bound- robust performance and generalization. In con-
aries of ecology and geography. This approach trast, the classification performance and diagnosis
enhances ecosystem stability, improves soil and accuracy are markedly enhanced by the GSABO–
water conservation, and promotes biodiversity. BP neural network with the optimal network pa-
In the random forest classifier, the number of rameters.
trees and the maximum depth of the trees are op- To further verify the accuracy and robustness
timized using the grid search method within the of the GSABO–BP neural network, all classifica-
ranges of {120, 200, 300} and {5, 8, 15}, respec- tion methods were tested using training sample
tively. At the same time, 3-fold cross-validation sizes ranging from 10 to 50, and testing sample
is combined to evaluate the performance of each sizes decreased correspondingly from 50 to 10.
parameter combination, thereby selecting the best For each method, the average diagnostic accuracy
parameters. The parameters of the SVM and BP over five runs was calculated and used as the eval-
neural network are set to default values, and the uation metric. The results are summarized in Ta-
SVM kernel function is set to the linear kernel ble 5.
function. Each classifier is run five times, and the Table 5 illustrates how the diagnostic accu-
average value of the five runs is taken as the final racy of all approaches steadily increases as the
665