Page 106 - IJPS-2-2
P. 106

Decomposing the Socio-economic Inequalities in Utilization of Full Antenatal Care in Jharkhand State, India

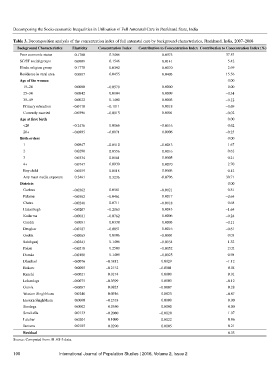
       Table 3. Decomposition analysis of the concentration index of full antenatal care by background characteristics, Jharkhand, India, 2007–2008
        Background Characteristics   Elasticity   Concentration Index   Contribution to Concentration Index  Contribution to Concentration Index (%)
         Poor economic status   −0.1780         0.5466               −0.0973                     37.53
         SC/ST social groups    −0.0909         0.1546               −0.0141                      5.42
         Hindu religion group    0.1778        −0.0392               −0.0070                      2.69
         Residence in rural area   −0.8867      0.0455               −0.0403                     15.56
         Age of the women                                                                         0.00
           15–24                 0.0000        −0.0570                0.0000                      0.00
           25–34                 0.0842         0.0104                0.0009                     −0.34
           35–49                 0.0022         0.1400                0.0003                     −0.12
           Primary education     −0.0178       −0.1011                0.0018                     −0.69
           Currently married     -0.0396       −0.0015                0.0001                     −0.02
         Age at first birth                                                                       0.00
           <20                  −0.2436         0.0066               −0.0016                      0.62
           20+                  −0.0895        −0.0071                0.0006                     −0.25
         Birth orders                                                                             0.00
           1                     0.0847        −0.0510               −0.0043                      1.67
           2                     0.0290        −0.0556               −0.0016                      0.62
           3                    −0.0334        −0.0161                0.0005                     −0.21
           4+                   −0.0747         0.0939               −0.0070                      2.70
           Boy child            −0.0259        −0.0118                0.0003                     −0.12
           Any mass media exposure   0.2461    −0.3236               -0.0796                     30.71
         Districts                                                                                0.00
           Garhwa               −0.0362         0.0581               −0.0021                      0.81
           Palamu               −0.0362        −0.0461                0.0017                     −0.64
           Chatra               −0.0248         0.0711               −0.0018                      0.68
           Hazaribagh           −0.0207        −0.2063                0.0043                     −1.64
           Kodarma              −0.0081        −0.0762                0.0006                     −0.24
           Giridih               0.0081         0.0338                0.0003                     −0.11
           Deoghar              −0.0187        −0.0851                0.0016                     −0.61
           Godda                −0.0065         0.0106               −0.0001                      0.03
           Sahibganj            −0.0243         0.1406               −0.0034                      1.32
           Pakur                −0.0210         0.2500               −0.0052                      2.02
           Dumka                −0.0180         0.1405               −0.0025                      0.98
           Dhanbad              −0.0076       −0.3812                 0.0029                     −1.12
           Bokaro                0.0005       −0.2132                −0.0001                      0.04
           Ranchi               −0.0021        0.0174                 0.0000                      0.01
           Lohardaga            −0.0075       −0.0399                 0.0003                     −0.12
           Gumla                −0.0087        0.0825                −0.0007                      0.28
           Western Singhbhum     0.0246        0.0916                 0.0023                     −0.87
           Eastern Singhbhum     0.0000       −0.2318                 0.0000                      0.00
           Simdega               0.0002        0.0550                 0.0000                      0.00
           Seraikella            0.0133       −0.2080                −0.0028                      1.07
           Latehar              −0.0204        0.1090                −0.0022                      0.86
           Jamatra               0.0185       −0.0290                −0.0005                      0.21
           Residual                                                                              −0.33
       Source: Computed from DLHS-3 data.

       100                International Journal of Population Studies | 2016, Volume 2, Issue 2
   101   102   103   104   105   106   107   108   109   110   111