
Page 105 - IJPS-2-2
P. 105
Abha Gupta, Pushpendra Kumar and Olalemi Adewumi Dorcas
characteristics. Figure 2 indicates that the predicted probability of using full ANC services increased
with an increase in the economic status of women. For example, the probability of full ANC utiliza-
tion among women from the richest wealth quintiles was the highest (0.41) compared to the women
from the poorest quintiles (0.07). A similar gradient pattern was found for education, with the proba-
bility of full ANC utilization highest among women who had post-secondary education (0.41), fol-
lowed by those who had secondary education (0.18) and those who had primary or had no formal
education (0.08) (Figure 3).
Table 3 presents results for decomposing the concentration index for ANC inequality. Decomposi-
tion analysis shows that the estimated value of the relative contribution to the concentration index
was negative in some selected socio-economic factors such as poor economic status (concentration
index= −0.10), SC/ST social groups (concentration index= −0.01), Hindu religion (concentration
index= −0.01), and residence in rural area (concentration index = −0.04). Therefore, it reflected that
weaker socio-economic groups in Jharkhand were more disadvantaged in accessing full ANC services.
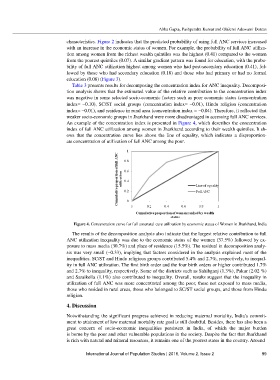
An example of the concentration index is presented in Figure 4, which describes the concentration
index of full ANC utilization among women in Jharkhand according to their wealth quintiles. It sh-
ows that the concentration curve lies above the line of equality, which indicates a disproportion-
ate concentration of utilization of full ANC among the poor.
Figure 4. Concentration curve for full antenatal care utilization by economic status of Women in Jharkhand, India
The results of the decomposition analysis also indicate that the largest relative contribution to full
ANC utilization inequality was due to the economic status of the women (37.5%) followed by ex-
posure to mass media (30.7%) and place of residence (15.5%). The residual in decomposition analy-
sis was very small (−0.33), implying that factors considered in the analysis explained most of the
inequalities. SC/ST and Hindu religious groups contributed 5.4% and 2.7%, respectively, to inequal-
ity in full ANC utilization. The first birth order and the four birth orders or higher contributed 1.7%
and 2.7% to inequality, respectively. Some of the districts such as Sahibganj (1.3%), Pakur (2.02 %)
and Saraikella (1.1%) also contributed to inequality. Overall, results suggest that the inequality in
utilization of full ANC was more concentrated among the poor, those not exposed to mass media,
those who resided in rural areas, those who belonged to SC/ST social groups, and those from Hindu
religion.
4. Discussion
Notwithstanding the significant progress achieved in reducing maternal mortality, India’s commit-
ment to attainment of low maternal mortality rate goal is still doubtful. Besides, there has also been a
great concern of socio-economic inequalities persistent in India, of which the major burden
is borne by the poor and other vulnerable populations in the society. Despite the fact that Jharkhand
is rich with natural and mineral resources, it remains one of the poorest states in the country. Around
International Journal of Population Studies | 2016, Volume 2, Issue 2 99