
Page 104 - IJPS-2-2
P. 104
Decomposing the Socio-economic Inequalities in Utilization of Full Antenatal Care in Jharkhand State, India
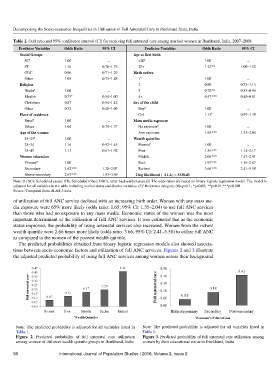
Table 2. Odd ratio and 95% confidence interval (CI) for receiving full antenatal care among married women in Jharkhand, India, 2007–2008
Predictor Variables Odds Ratio 95% CI Predictor Variables Odds Ratio 95% CI
Social Groups Age at first birth
SC a 1.00 − <20 a 1.00 −
ST 1.16 0.76–1.76 20+ 1.23** 1.00–1.52
OBC 0.96 0.71–1.29 Birth orders
Other 1.05 0.75–1.48 1 a 1.00 −
Religion 2 0.90 0.73–1.13
Hindu a 1.00 − 3 0.70** 0.53–0.94
Muslim 0.73 + 0.54–1.00 4+ 0.57*** 0.40–0.81
Christians 0.87 0.54–1.42 Sex of the child
Other 0.72 0.48–1.09 Boy a 1.00 −
+
Place of residence Girl 1.15 0.97–1.38
Rural a 1.00 − Mass media exposure
Urban 1.04 0.79–1.37 No exposure a 1.00 −
Age of the women Any exposure 1.65*** 1.35–2.04
15–25 a 1.00 − Wealth quintiles
25–34 1.16 0.92–1.45 Poorest a 1.00 −
35–49 1.13 0.67–1.92 Poor 1.56*** 1.14–2.17
Women education Middle 2.06*** 1.47–2.91
a
Primary 1.00 − Rich 1.97*** 1.36–2.87
Secondary 1.62*** 1.28–2.07 Richest 3.66*** 2.41–5.58
Above secondary 2.67*** 1.93–3.69 −2 log likelihood (−2 LL) = 3338.43
Note: (1) SCs: Scheduled castes; STs, Scheduled tribes; OBCs, other backward classes.(2) The odds ratios are based on binary logistic regression model. The model is
a
adjusted for all variables in the table including marital status and district variables. (3) Reference category. (4)+p<0.1; *p<0.05; **p<0.01;***p<0.001.
Source: Computed from DLHS-3 data.
of utilization of full ANC service declined with an increasing birth order. Women with any mass me-
dia exposure were 65% more likely (odds ratio: 1.65; 95% CI: 1.35–2.04) to use full ANC services
than those who had no exposure to any mass media. Economic status of the women was the most
important determinant of the utilization of full ANC services. It was estimated that as the economic
status improved, the probability of using antenatal services also increased. Women from the richest
wealth quintile were 2.66 times more likely (odds ratio: 3.66; 95% CI: 2.41–5.58) to utilize full ANC
as compared to the women of the poorest wealth quintile.
The predicted probabilities obtained from binary logistic regression models also showed associa-
tions between socio-economic factors and utilization of full ANC services. Figures 2 and 3 illustrate
the adjusted predicted probability of using full ANC services among women across their background
Note: The predicted probability is adjusted for all variables listed in Note: The predicted probability is adjusted for all variables listed in
Table 1. Table 1.
Figure 2. Predicted probability of full antenatal care utilization Figure 3. Predicted probability of full antenatal care utilization among
among women of different wealth quintile groups in Jharkhand, India women by their educational status in Jharkhand, India
98 International Journal of Population Studies | 2016, Volume 2, Issue 2