
Page 68 - IJPS-2-2
P. 68
Transition in risks of higher order births in Nepal: a life table analysis
∑ bx
i i
present paper) or hazard rate h(t) at any time t is given by ()ht = h 0 ()t e i where, h 0(t) is the base-
line hazard function when the x i are set equal to zero and indicates the expected risk of failure with
the explanatory variables set at zero; x i are explanatory variables and b i are the coefficients to be es-
timated in the model.
The study is based on cross-sectional database and it does not capture how individuals might
have changed their fertility behavior through time. This inherent limitation of cross-sectional data
over panel data is a limitation of this paper.
3. Results
3.1 The First Birth and Birth Intervals
The median age at first birth in Nepal was almost constant over the period 1996–2011. More than 85%
of women of different age cohorts had their first birth before age 25; the median age at first birth for
women ages 25–49 was around age 20 in 2011 (MOHP, New ERA, and ICF International, 2012;
MOHP, New ERA and Macro International, 2007; MOH, New ERA and ORC Macro, 2002; Pradhan,
Aryal, Regmi, et al., 1997). The median age at first birth for different age cohorts of women in
NDHS-2011 is shown in Table 1. The results show little variation in the median age at first birth for
different cohorts of women. The median age at first birth is around age 20 for all age cohorts.
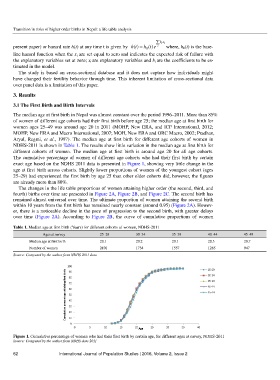
The cumulative percentage of women of different age cohorts who had their first birth by certain
exact age based on the NDHS 2011 data is presented in Figure 1, showing very little change in the
age at first birth across cohorts. Slightly lower proportions of women of the youngest cohort (ages
25–29) had experienced the first birth by age 25 than other older cohorts did; however, the figures
are already more than 80%.
The changes in the life table proportions of women attaining higher order (the second, third, and
fourth) births over time are presented in Figure 2A, Figure 2B, and Figure 2C. The second birth has
remained almost universal over time. The ultimate proportion of women attaining the second birth
within 10 years from the first birth has remained nearly constant (around 0.95) (Figure 2A). Howev-
er, there is a noticeable decline in the pace of progression to the second birth, with greater delays
over time (Figure 2A). According to Figure 2B, the curve of cumulative proportions of women
Table 1. Median age at first birth (Years) for different cohorts of women, NDHS-2011
Ages at survey 25–29 30–34 35–39 40–44 45–49
Median age at first birth 20.1 20.2 20.1 20.3 20.7
Number of women 2101 1734 1557 1285 947
Source: Computed by the author from NDHS 2011 data
Figure 1. Cumulative percentage of women who had their first birth by certain age, for different ages at survey, NDHS-2011
Source: Computed by the author from NDHS data 2011
62 International Journal of Population Studies | 2016, Volume 2, Issue 2