
Page 72 - IJPS-2-2
P. 72
Transition in risks of higher order births in Nepal: a life table analysis
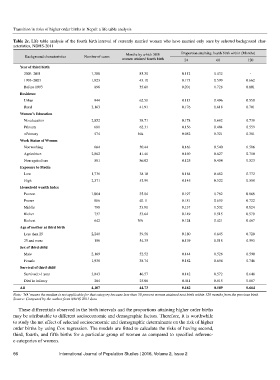
Table 2c. Life table analysis of the fourth birth interval of currently married women who have married only once by selected background char-
acteristics, NDHS-2011
Months by which 50% Proportion attaining fourth birth within (Months)
Background characteristics Number of cases women attained fourth birth 24 60 120
Year of third birth
2003–2011 1,388 85.30 0.112 0.432 -
1993–2003 1,823 43.10 0.173 0.599 0.662
Before 1993 896 35.60 0.201 0.728 0.801
Residence
Urban 944 62.50 0.113 0.496 0.550
Rural 3,163 41.91 0.176 0.618 0.701
Women’s Education
No education 2,852 38.71 0.178 0.662 0.739
Primary 681 62.31 0.156 0.484 0.559
>Primary 574 NA 0.082 0.321 0.381
Work Status of Women
Not working 664 50.44 0.163 0.540 0.586
Agriculture 2,862 41.46 0.169 0.627 0.710
Non-agriculture 581 86.02 0.125 0.454 0.523
Exposure to Media
Low 1,736 38.10 0.184 0.682 0.772
High 2,371 53.99 0.145 0.522 0.588
Household wealth Index
Poorest 1,064 35.84 0.197 0.762 0.868
Poorer 866 40.11 0.181 0.639 0.722
Middle 798 53.91 0.137 0.532 0.624
Richer 737 53.64 0.149 0.515 0.570
Richest 642 NA 0.124 0.421 0.467
Age of mother at third birth
Less than 25 2,240 39.58 0.180 0.645 0.720
25 and more 186 54.35 0.139 0.518 0.593
Sex of third child
Male 2,169 52.52 0.144 0.528 0.590
Female 1,938 38.74 0.182 0.656 0.746
Survival of third child
Survived >1 year 3,843 46.57 0.142 0.572 0.648
Died in infancy 264 25.06 0.441 0.815 0.887
All 4,107 44.73 0.162 0.589 0.664
Note: ‘NA’ means the median is not applicable for that category because less than 50 percent women attained next birth within 120 months from the previous birth
Source: Computed by the author from NDHS 2011 data
These differentials observed in the birth intervals and the proportions attaining higher order births
may be attributable to different socioeconomic and demographic factors. Therefore, it is worthwhile
to study the net effect of selected socioeconomic and demographic determinants on the risk of higher
order births by using Cox regression. The models are fitted to calculate the risks of having second,
third, fourth, and fifth births for a particular group of women as compared to specified referenc-
e categories of women.
66 International Journal of Population Studies | 2016, Volume 2, Issue 2