Page 70 - IJPS-2-2
P. 70

Transition in risks of higher order births in Nepal: a life table analysis

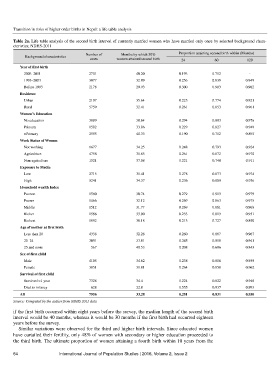
       Table 2a. Life table analysis of the second birth interval of currently married women who have married only once by selected background chara-
       cteristics, NDHS-2011

                                     Number of       Months by which 50%     Proportion attaining second birth within (Months)
            Background characteristics   cases     women attained second birth   24         60            120
          Year of first birth
           2003–2011                   2701                40.20             0.193         0.712           -
           1993–2003                   3077                32.89             0.256         0.839          0.949
           Before 1993                 2178                29.93             0.300         0.903          0.982
          Residence
           Urban                       2197                35.64             0.225         0.774          0.921
           Rural                       5759                32.41             0.261         0.853          0.961
          Women’s Education
           No education                3899                30.64             0.294         0.893          0.976
           Primary                     1502                33.06             0.229         0.827          0.949
           >Primary                    2555                40.33             0.190         0.712          0.895
          Work Status of Women
           Not working                 1677                34.25             0.248         0.793          0.924
           Agriculture                 4758                31.85             0.261         0.872          0.970
           Non-agriculture             1521                37.08             0.221         0.740          0.911
          Exposure to Media
           Low                         2715                31.41             0.278         0.873          0.974
           High                        5241                34.37             0.236         0.809          0.936
          Household wealth Index
           Poorest                     1560                30.74             0.279         0.913          0.979
           Poorer                      1466                32.12             0.269         0.863          0.975
           Middle                      1512                31.77             0.269         0.861          0.968
           Richer                      1566                33.90             0.233         0.813          0.951
           Richest                     1852                38.18             0.213         0.727          0.890
          Age of mother at first birth
           Less than 20                4338                32.28             0.260         0.867          0.967
           20–24                       3051                33.81             0.245         0.818          0.941
           25 and more                  567                40.53             0.208         0.686          0.843
          Sex of first child
           Male                        4105                34.62             0.238         0.806          0.939
           Female                      3851                31.81             0.264         0.858          0.962
          Survival of first child
           Survived >1 year            7328                34.4              0.224         0.822          0.946
           Died in infancy              628                22.8              0.555         0.937          0.993
          All                          7956                33.28             0.251         0.831          0.950
       Source: Computed by the author from NDHS 2011 data

       if the first birth occurred within eight years before the survey, the median length of the second birth
       interval would be 40 months, whereas it would be 30 months if the first birth had occurred eighteen
       years before the survey.
         Similar variations were observed for the third and higher birth intervals. Since educated women
       have curtailed their fertility, only 48% of women with secondary or higher education proceeded to
       the third birth. The ultimate proportion of women attaining a fourth birth within 10 years from the

       64                 International Journal of Population Studies | 2016, Volume 2, Issue 2
   65   66   67   68   69   70   71   72   73   74   75