Page 74 - IJPS-2-2
P. 74

Transition in risks of higher order births in Nepal: a life table analysis

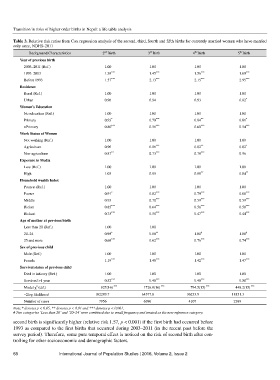
       Table 3. Relative risk ratios from Cox regression analysis of the second, third, fourth and fifth births for currently married women who have married
       only once, NDHS-2011
                                                                                                       th
                                             nd
                                                                                    th
                                                                 rd
             Background Characteristics      2  Birth           3  Birth           4  Birth           5  Birth
          Year of previous birth
           2003–2011 (Ref.)                   1.00               1.00               1.00               1.00
                                                                                       ***
                                                                   ***
                                                ***
                                                                                                          ***
           1993–2003                          1.39               1.45               1.56               1.69
                                                                   ***
                                                                                       ***
                                                ***
                                                                                                          ***
           Before 1993                        1.57               2.13               2.15               2.95
          Residence
           Rural (Ref.)                       1.00               1.00               1.00               1.00
           Urban                              0.96               0.94               0.93               0.82
                                                                                                          *
          Women’s Education
           No education (Ref.)                1.00               1.00               1.00               1.00
                                                                                                          *
                                                                   ***
                                                                                       **
           Primary                            0.93   *           0.79               0.84               0.81
                                                                                       ***
                                                                                                          ***
                                                ***
                                                                   ***
           >Primary                           0.80               0.56               0.60               0.54
          Work Status of Women
           Not working (Ref.)                 1.00               1.00               1.00               1.00
                                                                                                          *
                                                                                       **
                                                                   ***
           Agriculture                        0.96               0.86               0.82               0.82
                                                                                       ***
                                                                   ***
                                                **
           Non-agriculture                    0.87               0.73               0.78               0.96
          Exposure to Media
           Low (Ref.)                         1.00               1.00               1.00               1.00
                                                                                                          **
                                                                                       **
           High                               1.03               0.95               0.88               0.84
          Household wealth Index
           Poorest (Ref.)                     1.00               1.00               1.00               1.00
                                                                                                          ***
           Poorer                             0.91   *           0.82               0.79               0.68
                                                                   ***
                                                                                       ***
           Middle                             0.93               0.70               0.59               0.59
                                                                                                          ***
                                                                                       ***
                                                                   ***
                                                                                                          ***
                                                                   ***
                                                                                       ***
                                                ***
           Richer                             0.85               0.64               0.56               0.50
                                                                   ***
                                                ***
                                                                                       ***
                                                                                                          ***
           Richest                            0.75               0.50               0.47               0.44
          Age of mother at previous birth
           Less than 20 (Ref.)                1.00               1.00
           20–24                              0.95   *           0.88               1.00   #           1.00
                                                                   **
                                                                                                          #
                                                                                       ***
                                                ***
                                                                                                          ***
                                                                   ***
           25 and more                        0.69               0.62               0.76               0.74
          Sex of previous child
           Male (Ref.)                        1.00               1.00               1.00               1.00
                                                                                                          ***
                                                                                       ***
           Female                             1.19               1.48               1.42               1.47
                                                ***
                                                                   ***
          Survival status of previous child
           Died in infancy (Ref.)             1.00               1.00               1.00               1.00
                                                ***
                                                                   ***
                                                                                       ***
                                                                                                          ***
           Survived >1 year                   0.52               0.48               0.48               0.50
                2
           Model χ  (d.f.)                  927(16)  ***      1726.9(16)  ***     794.5(15)  ***     448.2(15)  ***
           −2log likelihood               102289.7           64577.8            36233.9             18151.3
           Number of cases                 7956               6396               4107               2389
       Note:* denotes p < 0.05, ** denotes p < 0.01 and *** denotes p < 0.001.
       # Two categories ‘Less than 20’ and ‘20–24’ were combined due to small frequency and treated as the new reference category.

       second birth is significantly higher (relative risk 1.57, p < 0.001) if the first birth had occurred before
       1993 as compared to the first births that occurred during 2003–2011 (in the recent past before the
       survey period). Therefore, some pure temporal effect is noticed on the risk of second birth after con-
       trolling for other socioeconomic and demographic factors.
       68                 International Journal of Population Studies | 2016, Volume 2, Issue 2
   69   70   71   72   73   74   75   76   77   78   79