
Page 69 - IJPS-2-2
P. 69
Ramesh Babu Kafle
attaining the third birth reached an asymptote of 0.9 in 2001, but it tapered to around 0.75 in 2011.
Both a declining prevalence of third births and slower pace of transition are evident over time. Analysis
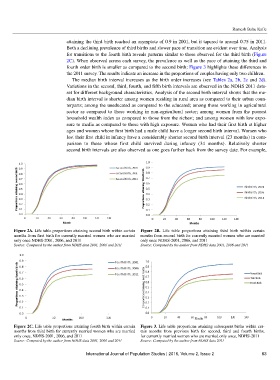
for transitions to the fourth birth reveals patterns similar to those observed for the third birth (Figure
2C). When observed across each survey, the prevalence as well as the pace of attaining the third and
fourth order birth is smaller as compared to the second birth; Figure 3 highlights these differences in
the 2011 survey. The results indicate an increase in the proportions of couples having only two children.
The median birth interval increases as the birth order increases (see Tables 2a, 2b, 2c and 2d).
Variations in the second, third, fourth, and fifth birth intervals are observed in the NDHS 2011 data-
set for different background characteristics. Analysis of the second birth interval shows that the me-
dian birth interval is shorter among women residing in rural area as compared to their urban coun-
terparts; among the uneducated as compared to the educated; among those working in agricultural
sector as compared to those working in non-agricultural sector; among women from the poorest
household wealth index as compared to those from the richest; and among women with low expo-
sure to media as compared to those with high exposure. Women who had their first birth at higher
ages and women whose first birth had a male child have a longer second birth interval. Women who
lost their first child in infancy have a considerably shorter second birth interval (23 months) in com-
parison to those whose first child survived during infancy (34 months). Relatively shorter
second birth intervals are also observed as one goes further back from the survey date. For example,
Figure 2A. Life table proportions attaining second birth within certain Figure 2B. Life table proportions attaining third birth within certain
months from first birth for currently married women who are married months from second birth for currently married women who are married
only once NDHS-2001, 2006, and 2011 only once NDHS-2001, 2006, and 2011
Source: Computed by the author from NDHS data 2001, 2006 and 2011 Source: Computed by the author from NDHS data 2001, 2006 and 2011
Figure 2C. Life table proportions attaining fourth birth within certain Figure 3. Life table proportions attaining subsequent births within cer-
months from third birth for currently married women who are married tain months from previous birth for second, third and fourth births,
only once, NDHS-2001, 2006, and 2011 for currently married women who are married only once, NDHS-2011
Source: Computed by the author from NDHS data 2001, 2006 and 2011 Source: Computed by the author from NDHS data 2011
International Journal of Population Studies | 2016, Volume 2, Issue 2 63