Page 71 - IJPS-2-2
P. 71

Ramesh Babu Kafle

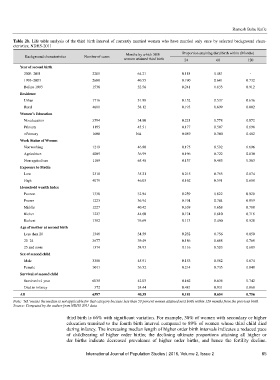
       Table 2b. Life table analysis of the third birth interval of currently married women who have married only once by selected background chara-
       cteristics, NDHS-2011

                                                       Months by which 50%     Proportion attaining third birth within (Months)
            Background characteristics   Number of cases     women attained third birth   24   60         120
          Year of second birth
           2003–2011                    2261                64.21             0.118         0.481          -
           1993–2003                    2600                40.55             0.190         0.641         0.732
           Before 1993                  1536                32.56             0.241         0.833         0.912
          Residence
           Urban                        1716                51.98             0.152         0.537         0.636
           Rural                        4681                38.12             0.193         0.699         0.802
          Women’s Education
           No education                 3594                34.80             0.221         0.778         0.872
           Primary                      1195                45.51             0.177         0.587         0.698
           >Primary                     1608               NA                 0.089         0.380         0.482
          Work Status of Women
           Not working                  1219                46.80             0.175         0.592         0.696
           Agriculture                  4009                36.99             0.196         0.722         0.830
           Non-agriculture              1169                65.48             0.137         0.485         0.563
          Exposure to Media
           Low                          2318                35.21             0.215         0.765         0.874
           High                         4079                46.03             0.162         0.591         0.688
          Household wealth Index
           Poorest                      1338                32.94             0.259         0.822         0.929
           Poorer                       1223                36.94             0.194         0.744         0.859
           Middle                       1227                40.42             0.169         0.668         0.788
           Richer                       1227                44.60             0.174         0.610         0.716
           Richest                      1382                76.69             0.113         0.450         0.528
          Age of mother at second birth
           Less than 20                 1346                34.59             0.232         0.756         0.850
           20–24                        3677                39.49             0.186         0.668         0.769
           25 and more                  1374                58.93             0.116         0.503         0.609
          Sex of second child
           Male                         3386                45.91             0.153         0.582         0.674
           Female                       3011                36.52             0.214         0.735         0.848
          Survival of second child
           Survived >1 year             6035                42.03             0.162         0.636         0.742
           Died in infancy               372                24.44             0.481         0.931         0.968
          All                           6397                40.38             0.181         0.654         0.756
       Note: ‘NA’ means the median is not applicable for that category because less than 50 percent women attained next birth within 120 months from the previous birth
       Source: Computed by the author from NDHS 2011 data

                             third birth is 66% with significant variation. For example, 38% of women with secondary or higher
                             education transited to the fourth birth interval compared to 89% of women whose third child died
                             during infancy. The increasing median length of higher order birth intervals indicates a reduced pace
                             of  childbearing of  higher order  births; the declining ultimate  proportions attaining  all higher  or
                             der births  indicate decreased prevalence of  higher order  births,  and  hence the fertility decline.


                                     International Journal of Population Studies | 2016, Volume 2, Issue 2      65
   66   67   68   69   70   71   72   73   74   75   76