
Page 33 - IJPS-6-1
P. 33
Patel and Pradhan
Public internet 2.00 2.00 2.00 2.00 2.00 2.00 2.00 2.00 2.00 2.00 2.00 2.00 2.00 2.00 2.00 2.00 2.00 2.00 2.00 2.00 2.00 2.00 2.00 2.00 2.00 2.00 2.00 2.00 (Contd...)
Public telephone 2.00 2.00 2.00 2.00 2.00 2.00 2.00 2.00 2.00 2.00 2.00 2.00 2.00 2.00 2.00 2.00 2.00 2.00 2.00 2.00 2.00 2.00 2.00 2.00 2.00 2.00 2.00 2.00
Population per theatre 1.80 1.00 0.60 0.40 0.20 2.00 0.60 1.40 0.40 1.60 1.00 0.60 1.40 1.40 1.80 0.20 1.80 0.40 1.00 0.20 1.20 1.60 1.80 2.00 1.00 1.60 0.40 1.40
Proportion of household having mobile 1.28 1.26 1.25 1.39 1.46 1.31 1.34 1.29 1.25 1.23 1.24 1.28 1.32 1.25 1.46 1.39 1.22 1.26 1.14 1.43 1.34 1.38 1.41 1.48 1.36 1.34 1.36 1.38
Proportion of household having TV 1.79 1.70 1.91 1.69 1.83 1.69 1.75 1.76 1.67 1.63 1.69 1.82 1.68 1.74 1.74 1.83 1.55 1.70 1.53 1.32 1.77 1.57 1.56 1.65 1.56 1.53 1.66 1.62
Proportion of household with electricity 1.76 1.29 2.00 2.00 2.00 2.00 1.96 2.00 1.89 1.55 1.95 1.94 1.38 1.58 2.00 1.61 1.35 1.55 1.48 1.56 1.65 1.70 1.76 0.77 2.00 1.09 1.88 1.67
APPENDIX Electricity services 2.00 2.00 2.00 2.00 2.00 2.00 2.00 2.00 2.00 2.00 2.00 2.00 2.00 2.00 2.00 2.00 2.00 2.00 2.00 2.00 2.00 2.00 2.00 2.00 2.00 2.00 2.00 2.00
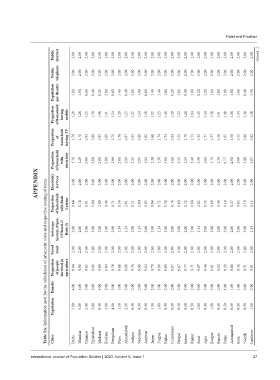
Table 1A. Information used for the calculation of urbanicity scale and respective scoring of items.
Proportion of household with flush Latrine 1.64 0.74 1.91 2.00 2.00 1.46 1.71 1.36 2.01 1.31 2.00 0.95 0.94 1.72 1.74 1.76 1.60 1.72 1.00 2.02 1.73 1.69 1.54 0.14 1.47 0.65 1.19 1.12
Sewerage System (Open- 1/Closed-2/ Both-3) 2.00 2.00 2.00 2.00 2.00 2.00 2.00 1.34 1.34 2.00 1.34 2.00 2.00 1.34 2.00 2.00 2.00 2.00 2.00 1.34 2.00 2.00 2.00 2.00 2.00 2.00 2.00 1.34
Paved road 2.00 2.00 2.00 2.00 2.00 2.00 2.00 2.00 2.00 2.00 2.00 2.00 2.00 2.00 2.00 2.00 2.00 2.00 2.00 2.00 2.00 2.00 2.00 2.00 2.00 2.00 2.00 2.00
Proportion of people involved in agriculture 9.94 9.90 9.85 9.60 9.89 9.84 9.78 9.88 9.86 9.76 9.69 9.64 9.70 9.86 9.85 9.87 9.67 9.77 9.71 9.87 9.46 9.61 9.52 9.29 9.60 9.56 9.51 9.61
Density 4.00 5.00 5.00 5.00 4.00 5.00 3.00 5.00 3.00 2.00 2.00 5.00 2.00 3.00 2.00 2.00 2.00 3.00 2.00 3.00 3.00 3.00 2.00 4.00 1.00 1.00 2.00 2.00
Population 5.00 5.00 2.00 3.00 0.50 2.00 4.00 1.50 2.50 0.50 0.50 0.50 1.50 1.00 0.50 0.50 0.50 0.50 0.50 2.00 0.50 1.00 0.50 0.50 0.50 0.50 0.50 1.00
Cities Delhi Mumbai Chennai Hyderabad Madurai Kolkata Bengaluru Pune Ahmadabad Jodhpur Vadodara Amritsar Jaipur Nagpur Rajkot Coimbatore Bhopal Indore Raipur Surat Agra Kanpur Ranchi Patna Aurangabad Kota Nashik Lucknow
International Journal of Population Studies | 2020, Volume 6, Issue 1 27