
Page 34 - IJPS-6-1
P. 34
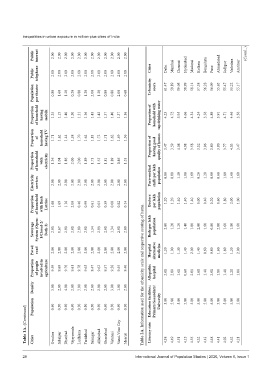
Inequalities in urban exposure in million-plus cities of India


               Public   internet  2.00  2.00  2.00  2.00  2.00  2.00  2.00  2.00  2.00  2.00  2.00  2.00  Ahmadabad  (Contd...)


               Public   telephone  2.00  2.00  2.00  2.00  2.00  2.00  2.00  2.00  2.00  2.00  2.00  2.00  Cities  Delhi  Mumbai   Chennai  Hyderabad  Madurai  Kolkata  Bengaluru  Pune  Jodhpur  Vadodara  Amritsar


               Population   per theatre  0.80  1.60  1.20  0.20  0.80  1.20  2.00  1.20  0.80  0.80  2.00  0.60  Urbanicity   score  61.47  59.89  59.05  58.99  58.14  57.38  56.28  56.09  55.65  55.47  55.22  55.17


               Proportion   of household   having   mobile  1.25  1.15  1.40  1.30  1.31  1.36  1.45  1.42  1.37  1.40  1.37  1.36  Proportion of   household with   tap drinking water  4.23  4.72  3.95  4.66  4.34  4.24  3.56  4.89  3.91  4.71  4.46  3.56


               Proportion   of   household   having TV  1.71  1.62  1.44  1.58  1.70  1.64  1.83  1.72  1.71  1.62  1.59  1.56  Proportion of   having good   quality of houses  3.47  3.59  4.08  4.08  3.58  3.32  3.96  3.80  3.80  3.77  4.03  3.47


               Proportion   of household   with   electricity  1.36  1.04  1.86  2.00  2.00  1.89  1.73  1.55  1.81  1.89  0.86  1.53


               Electricity   services  2.00  2.00  2.00  2.00  2.00  2.00  2.00  2.00  2.00  2.00  2.00  2.00  Para-medical   staffs per lakh   population  0.80  0.80  1.40  1.00  1.60  0.20  1.20  0.60  0.60  1.80  1.60  1.60


               Proportion   of household   with flush   Latrine  1.68  1.69  1.16  2.00  0.46  0.99  0.61  0.05  0.39  0.00  0.82  0.14  Doctors   per lakh   population  1.20  1.20  1.40  1.40  1.40  0.00  0.40  0.20  0.60  1.80  2.00  1.00


               Sewerage   System (Open-  1/Closed-2/  Both-3)  2.00  0.67  2.00  2.00  2.00  2.00  1.34  2.00  2.00  1.34  2.00  2.00  Beds per lakh   population  2.00  1.20  1.20  1.40  1.80  2.00  1.60  0.80  2.00  1.60  1.80  1.60


               Paved   road  2.00  2.00  2.00  2.00  2.00  2.00  2.00  2.00  2.00  2.00  2.00  2.00  Hospital   alternative   medicine  1.20  1.00  1.40  1.40  2.00  1.40  0.60  0.80  1.60  1.80  1.20  2.00


               Proportion   of people   involved in   agriculture  9.59  9.69  9.76  9.61  9.78  9.65  9.47  9.62  9.57  9.56  9.55  9.40 Table 2A. Information used for the urbanicity scale and respective scoring of items.  Allopathic   hospital  2.00  2.00  1.60  0.60  2.00  1.60  1.40  2.00  1.80  1.40  1.20  1.00


               Density  3.00  2.00  4.00  2.00  3.00  2.00  2.00  2.00  2.00  3.00  1.00  2.00  Education facilities:   Primary/Secondary/  University  5.00  5.00  5.00  5.00  5.00  5.00  5.00  5.00  5.00  5.00  5.00  5.00


            Table 1A. (Continued)  Population  Cities  0.50  Gwalior  0.50  Jabalpur  0.50  Dhanbad  0.50  Vijayawada  0.50  Ludhiana  0.50  Faridabad  0.50  Srinagar  0.50  Allahabad  0.50  Ghaziabad  0.50  Varanasi  0.50 Vasai-Virar City  0.50  Meerut  Literacy rate  4.38  4.49  4.51  4.15  4.55  4.32  4.43  4.48  4.41  4.02  4.52  4.21


           28                                              International Journal of Population Studies | 2020, Volume 6, Issue 1