
Page 37 - IJPS-7-1
P. 37
Miladinov
The results estimate that the CDR effect is negative and statistically significant at the 5% level in the first regime (1965
– 1975) and fifth regime (2013 – 2021), thus the effect of the CDR was to decrease the POPG rate during these regimes.
The effect of CDR during the second regime (1976 – 1983) and during the fourth regime (2004 – 2012) is with positive
signs and statistically significant at 5% level. The effect of TFR on POPG was found to be with positive signs in all of the
regimes but only statistically significant at 5% level in three regimes: (1965 – 1975), (1984 – 2003), and (2004 – 2012).
Thus, the explanation is that higher TFR led to higher POPG. From Table 1, it is revealed that the NMR has a negative
statistically significant effect on POPG only during the first regime (1965 – 1975) and with a positive effect for the rest of
the regimes, except for the third regime (1984 – 2003) where its effect was positive but not significant at 5% level. In the
model, the rate of POPG was greatly influenced by the effect of the change of the constant (intercept), from the second to
the fourth regime, that is, from 1976 to 2012. What was interesting is that especially during the third and fourth regimes,
that is, during 1984 – 2012, the POPG was under negative influence from the constant (intercept). There are, however,
some unique and specific aspects or features of the breakpoint regression in Table 1 that deserves discussion. Thus, in
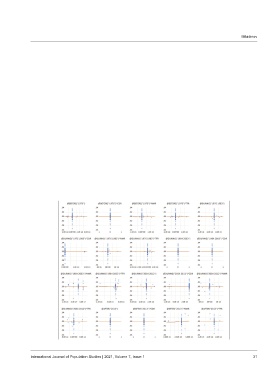
leverage plots, Figure 2 shows graphs which are labeled with the fully dummy variable interactions.
Leverage is a measure of how much each data point influences the regression. Leverage plots are the multivariate
equivalent of a simple residual plot in a univariate regression. Like influence statistics, leverage plots can be used as
a method for identifying influential observations or outliers. From our Figure 2, it can be observed that there are a lot
of observations that have more leverage on, that is, the potential to influence the regression line, either in a positive
or negative direction. Moreover, according to that, they tend to be closer to the regression fit with a large influence
on the analysis. Thus, the influential points have a large influence on the fit of the model. An especially important
influence of the outliers on the regression line is worth mentioning: the data points of NMR during 1984 and 2003,
during 2004 and 2013, and after 2013. Also, it is worth to mention the influence of the data points of TFR during 2004
and 2012 and after 2013.
Influence statistics are a method of discovering influential observations or outliers. This method serves to measure
the difference that one observation makes on the regression results, or how different one observation is from other
observations in a sample equation (IHS Global Inc., 2017). A plot of the influence statistics of R Student test (Figure 3)
clearly shows that observations of 2000 – 2001 and 2017 – 2001 years are outliers. The influence statistics of DFFITS plot
Figure 2. Leverage plots: Log(POPG) versus variables (partial led on regressors). Source: Author’s design based on real data.
International Journal of Population Studies | 2021, Volume 7, Issue 1 31