
Page 57 - IJPS-9-3
P. 57
International Journal of
Population Studies Intentional random mathematical model of immigration
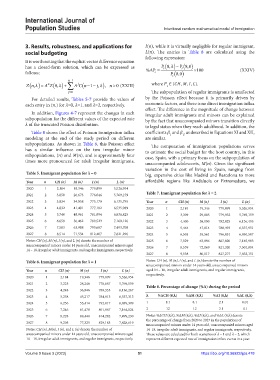
3. Results, robustness, and applications for (), while it is virtually negligible for regular immigrant,
social budgeting (). The entries in Table 8 are calculated using the
following expression:
It is worth noting that the explicit vector difference equation
has a closed-form solution, which can be expressed as %P P i , 8 P 8 , 0 100 (XXIV)
i
,
follows: i P 80
i
n1
j
n
Zn, AZ , 0 AC n 1 j, , n 0 (XXIII) where ∈ {, , , }.
j0 The subpopulation of regular immigrants is unaffected
For detailed results, Tables 5-7 provide the values of by the Poisson effect because it is primarily driven by
each entry in (,) for =0, =1, and =2, respectively. economic factors, and there is no direct immigration influx
effect. The difference in the magnitude of change between
In addition, Figures 4-7 represent the changes in each irregular adult immigrants and minors can be explained
subpopulation for the different values of the expected rate by the fact that unaccompanied minors transition directly
of the truncated Poisson distribution. to legal status when they reach adulthood. In addition, the
Table 8 shows the effect of Poisson immigration influx coefficients and , as described in Equations XI and XII,
2
1
modeling at the end of the study period on different are similar.
subpopulations. As shown in Table 8, this Poisson effect The computation of immigration populations serves
has a similar influence on the two irregular minor to estimate the social budget for the host country, in this
subpopulations, () and (), and is approximately four case, Spain, with a primary focus on the subpopulation of
times more pronounced for adult irregular immigrants,
unaccompanied adolescents, M(). Given the significant
variation in the cost of living in Spain, ranging from
Table 5. Immigrant population for λ = 0 big, expensive cities like Madrid and Barcelona to more
Year n CH (n) M (n) I (n) L (n) affordable regions like Andalucía or Extremadura, we
2020 1 2,184 19,346 779,899 5,526,954
Table 7. Immigrant population for λ = 2
2021 2 3,050 26,673 776,046 5,769,159
2022 3 3,934 34,058 775,170 6,135,795 Year n CH (n) M (n) I (n) L (n)
2023 4 4,832 41,491 777,182 6,535,989 2020 1 2,184 19,346 779,899 5,526,954
2024 5 5,740 48,961 781,994 6,836,825 2021 2 3,309 29,005 779,932 5,769,159
2025 6 6,658 56,462 789,523 7,160,126 2022 3 4,400 38,190 782,825 6,136,495
2026 7 7,583 63,988 799,687 7,493,708 2023 4 5,464 47,014 788,493 6,537,951
2027 8 8,514 71,534 812,407 7,821,296 2024 5 6,505 55,561 796,851 6,840,507
Notes: CH (n), M (n), I (n), and L (n) denote the number of 2025 6 7,529 63,896 807,820 7,165,903
unaccompanied minors under 14 years old, unaccompanied minors aged 2026 7 8,539 72,069 821,320 7,501,894
14 – 18, irregular adult immigrants, and regular immigrants, respectively.
2027 8 9,538 80,117 837,277 7,832,151
Table 6. Immigrant population for λ = 1 Notes: CH (n), M (n), I (n), and L (n) denote the number of
unaccompanied minors under 14 years old, unaccompanied minors
Year n CH (n) M (n) I (n) L (n) aged 14 – 18, irregular adult immigrants, and regular immigrants,
respectively.
2020 1 2,184 19,346 779,899 5,526,954
2021 2 3,225 28,246 778,667 5,769,159
Table 8. Percentage of change (%∆) during the period
2022 3 4,248 36,846 780,335 6,136,267
2023 4 5,258 45,217 784,813 6,537,313 λ %∆CH (8,λ) %∆M (8,λ) %∆I (8,λ) %∆L (8,λ)
2024 5 6,256 53,414 792,017 6,839,309 1 8.1 8.1 2.1 0.01
2025 6 7,246 61,478 801,867 7,164,024 2 12 12 3.1 0.1
2026 7 8,228 69,440 814,282 7,499,230 Notes: %∆CH (8,λ), %∆M (8,λ), %∆I (8,λ), and %∆L (8,λ) denote
the percentage of change from 2020 to 2027 in the populations of
2027 8 9,205 77,325 829,185 7,828,619
unaccompanied minors under 14 years old, unaccompanied minors aged
Notes: CH (n), M(n), I (n), and L (n) denote the number of 14–18, irregular adult immigrants, and regular immigrants, respectively.
unaccompanied minors under 14 years old, unaccompanied minors aged These values are calculated for both scenarios of = 1 and = 2, which
14 – 18, irregular adult immigrants, and regular immigrants, respectively. represent different expected rate of immigration influx events in a year.
Volume 9 Issue 3 (2023) 51 https://doi.org/10.36922/ijps.478