
Page 56 - IJPS-9-3
P. 56
International Journal of
Population Studies Intentional random mathematical model of immigration
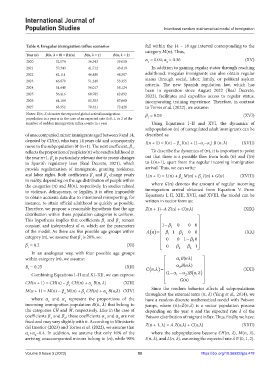
Table 4. Irregular immigration influx scenarios fall within the 14 – 18 age interval corresponding to the
category (). Thus,
Year (n) B(n, λ = 0) = B1(n) B(n, λ = 1) B(n, λ = 2)
2020 32,574 36,943 39,050 α = 0.04; α = 0.36 (XV)
1
2
2021 37,343 41,712 43,819 In addition to gaining regular status through reaching
2022 42,111 46,480 48,587 adulthood, irregular immigrants can also obtain regular
2023 46,879 51,248 53,355 status through social, labor, family, or political asylum
criteria. The new Spanish regulation law, which has
2024 51,648 56,017 58,124 been in operation since August 2022 (Real Decreto,
2025 56,416 60,785 62,892 2022), facilitates and expedites access to regular status,
2026 61,184 65,553 67,660 incorporating training experience. Therefore, in contrast
2027 65,952 70,321 72,428 to Torres et al. (2022), we assume:
Notes: (, ) denotes the expected global arrival immigration β = 0.03 (XVI)
population in a year n in the case of an expected rate =0, 1, or 2 of the 3
number of sudden immigration influx events in a year Using Equations I–II and XVI, the dynamics of
subpopulation () of unregulated adult immigrants can be
of unaccompanied minor immigrants aged between 9 and 14, described as:
denoted by (), who turn 14 years old and consequently I(n + 1) = I(n) − β I(n) + (1−α −α ) B (n, λ) (XVII)
move to the subpopulation (+1). The next coefficient, , 3 1 2
2
reflects the proportion of people in () who reach adulthood in To describe the dynamics of (), it is important to point
the year +1. is particularly relevant due to recent changes out that there is a possible flow from both () and ()
2
in Spanish regulatory laws (Real Decreto, 2021), which to (+1), apart from the regular incoming immigration
provide regularization of immigrants, granting residence, arrival. Thus, we can write:
and labor rights. Both coefficients and change yearly L(n + 1) = L(n) + β M(n) + β I(n) + G(n) (XVIII)
1
2
in reality, depending on the age distribution of people within 2 3
the categories () and (), respectively. In studies related where () denotes the amount of regular incoming
to violence, delinquency, or legality, it is often impossible immigration arrival obtained from Equation V. From
to obtain accurate data due to intentional misreporting, for Equations I, II, XIII, XVII, and XVIII, the model can be
instance, to attain official adulthood as quickly as possible. written in vector form as:
Therefore, we propose a reasonable hypothesis that the age Z(n + 1)=A Z(n) + C(n,λ) (XIX)
distribution within these population categories is uniform.
This hypothesis implies that coefficients and remain
1
2
constant and independent of , which are the parameters 1 1 0 0 0
of the model. As there are five possible age groups within An 1 1 2 0 0 (XX)
category (), we assume that is 20%, so:
1 0 0 1 3 0
β = 0.2 (XI) 0 1
1 2 3
In an analogous way, with four possible age groups
within category (), we assume: 1 Bn( )
Β = 0.25 (XII) 2 Bn( )
2 Cn, ) (XXI)
Bn,
1
Combining Equations I–II and XI–XII, we can express: ( 2
1
CH(n + 1) = CH(n) − β CH(n) + α B(n, λ) (XIII) Gn ()
1 1
M(n + 1) = M(n) − β M(n) + β CH(n) + α B(n,λ) (XIV) Since the random behavior affects all subpopulations
2 1 2 throughout the external term (, ) (Yang et al., 2014), we
where and represent the proportions of the have a random discrete mathematical model with Poisson
1
2
incoming immigration population (, ) that belong to jumps, where ()=(,) is a vector population process
the categories and , respectively. Like in the case of depending on the year and the expected rate of the
coefficients and , these coefficients and are not Poisson distribution of migrant influx. Thus, finally, we have:
1
1
2
2
fixed and may vary slightly with . According to Ministerio
del Interior (2023) and Torres et al. (2022), we assume that Z(n + 1, λ) = A Z(n,λ) + C(n,λ) (XXII)
+ =0.4. In addition, we assume that only 10% of the where the subpopulations become (, ), (, ),
2
1
arriving unaccompanied minors belong to (), while 90% (, ), and (, ), assuming the expected rate ∈ {0, 1, 2}.
Volume 9 Issue 3 (2023) 50 https://doi.org/10.36922/ijps.478