
Page 54 - IJPS-9-3
P. 54
International Journal of
Population Studies Intentional random mathematical model of immigration
Table 1. Historical Spanish irregular immigration
Government (year) Steady irregular immigration Sudden influx immigration Overall entries
Conservative Spanish Governments
2013 3,237 - 3,237
2014 4,552 - 4,552
2015 5,312 - 5,312
2016 8,162 - 8,162
2017 21,917 - 21,917
Socialist Spanish Governments
2018 - - 57,498
2019 26,103 - 26,103
2020 31,949 8,157 40,106
2021 40,100 8,000 48,100
Notes: The data for 2013–2017 corresponds to periods of conservative Spanish Governments, while the data for 2018–2021 corresponds to periods of
socialist Spanish Governments.
marked by the sudden influx of immigrants in the Canary
Islands in November 2020 (La Información, 2020) and
the unregulated influx of immigrants in Ceuta in May
2021 (Faus & Landauro, 2021), motivated by an “open
door” strategy of the Morocco government. This is why we
present the amount of irregular immigrants for these two
years in two separate columns in Table 1.
We address the modeling of the deterministic
component of the incoming immigration process using
a linear regression function. To capture this predictable
tendency, we removed the outlier data corresponding to
the years 2018 and 2020 in Table 1.
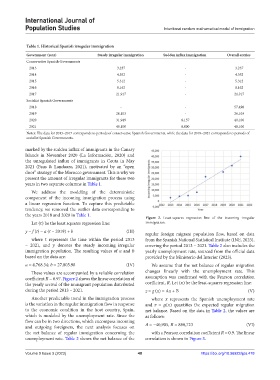
Figure 2. Least-squares regression line of the incoming irregular
Let () be the least squares regression line: immigration.
y = f (t) = a (t − 2019) + b (III)
regular foreign migrant population flow, based on data
where represents the time within the period 2013 from the Spanish National Statistical Institute (INE, 2023),
– 2021, and denotes the steady incoming irregular covering the period 2013 – 2021. Table 2 also includes the
immigration population. The resulting values of and yearly unemployment rate, sourced from the official data
based on the data are: provided by the Ministerio del Interior (2023).
a = 4,768.34; b = 27,805.98 (IV) We assume that the net balance of regular migration
These values are accompanied by a reliable correlation changes linearly with the unemployment rate. This
coefficient = 0.97. Figure 2 shows the linear correlation of assumption was confirmed with the Pearson correlation
the yearly arrival of the immigrant population distributed coefficient, . Let () be the least-squares regression line:
during the period 2013 – 2021. z = g (x) = Ax + B (V)
Another predictable trend in the immigration process where represents the Spanish unemployment rate
is the variation in the regular immigration flow in response and = () quantifies the expected regular migration
to the economic condition in the host country, Spain, net balance. Based on the data in Table 2, the values are
which is modeled by the unemployment rate. Since the as follows:
flow can be in two directions, which encompass incoming
and outgoing foreigners, the next analysis focuses on = −40,905, = 880,723 (VI)
the net balance of regular immigration concerning the with a Pearson correlation coefficient = 0.9. The linear
unemployment rate. Table 2 shows the net balance of the correlation is shown in Figure 3.
Volume 9 Issue 3 (2023) 48 https://doi.org/10.36922/ijps.478