
Page 85 - ITPS-7-1
P. 85
INNOSC Theranostics and
Pharmacological Sciences PfHSP and polyamines interactions
A B
C D
E
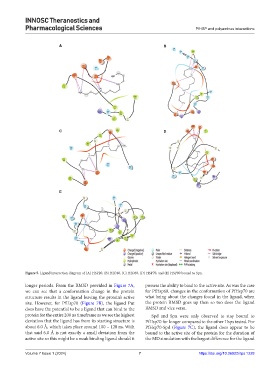
Figure 5. Ligand interaction diagram of (A) HSP20, (B) HSP40, (C) HSP60, (D) HSP70, and (E) HSP90 bound to Spn.
longer periods. From the RMSD provided in Figure 7A, possess the ability to bind to the active site. As was the case
we can see that a conformation change in the protein for PfHsp60, changes in the conformation of PfHsp70 are
structure results in the ligand leaving the protein’s active what bring about the changes found in the ligand, when
site. However, for PfHsp70 (Figure 7B), the ligand Put the protein RMSD goes up then so too does the ligand
does have the potential to be a ligand that can bind to the RMSD and vice versa.
protein for the entire 200 ns timeframe as we see the highest Spd and Spn were only observed to stay bound to
deviation that the ligand has from its starting structure is PfHsp70 for longer compared to the other Hsps tested. For
about 6.0 Å, which takes place around 100 – 120 ns. With PfHsp70-Spd (Figure 7C), the ligand does appear to be
that said 6.0 Å is not exactly a small deviation from the bound to the active site of the protein for the duration of
active site so this might be a weak binding ligand should it the MD simulation with the largest difference for the ligand
Volume 7 Issue 1 (2024) 7 https://doi.org/10.36922/itps.1228