
Page 18 - JCAU-6-2
P. 18
Journal of Chinese
Architecture and Urbanism Leisure-time physical activity
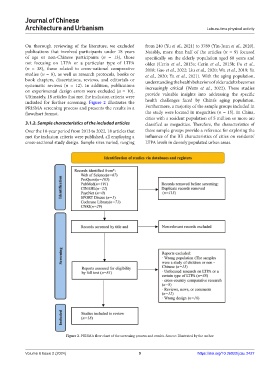
On thorough reviewing of the literature, we excluded from 240 (Yu et al., 2021) to 3789 (Yin-Juan et al., 2020).
publications that involved participants under 18 years Notably, more than half of the articles (n = 9) focused
of age or non-Chinese participants (n = 13), those specifically on the elderly population aged 60 years and
not focusing on LTPA or a particular type of LTPA older (Cerin et al., 2013a; Cerin et al., 2013b; Fu et al.,
(n = 38), those related to cross-national comparative 2018; Gao et al., 2022; Liu et al., 2020; Wu et al., 2019; Yu
studies (n = 8), as well as research protocols, books or et al., 2020; Yu et al., 2021). With the aging population,
book chapters, dissertations, reviews, and editorials or understanding the health behaviors of older adults becomes
systematic reviews (n = 12). In addition, publications increasingly critical (Watts et al., 2022). These studies
on experimental design errors were excluded (n = 10). provide valuable insights into addressing the specific
Ultimately, 18 articles that met the inclusion criteria were
included for further screening. Figure 2 illustrates the health challenges faced by China’s aging population.
PRISMA screening process and presents the results in a Furthermore, a majority of the sample groups included in
flowchart format. the study were located in megacities (n = 15). In China,
cities with a resident population of 5 million or more are
3.1.2. Sample characteristics of the included articles classified as megacities. Therefore, the characteristics of
Over the 10-year period from 2013 to 2022, 18 articles that these sample groups provide a reference for exploring the
met the inclusion criteria were published, all employing a influence of the BE characteristics of cities on residents’
cross-sectional study design. Sample sizes varied, ranging LTPA levels in densely populated urban areas.
Figure 2. PRISMA flow chart of the screening process and results. Source: Illustrated by the author
Volume 6 Issue 2 (2024) 9 https://doi.org/10.36922/jcau.2427