
Page 17 - JCAU-6-2
P. 17
Journal of Chinese
Architecture and Urbanism Leisure-time physical activity
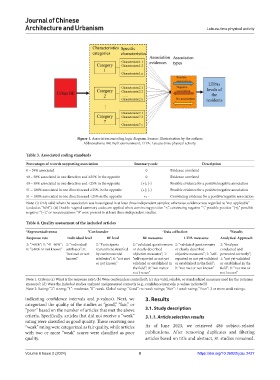
Figure 1. Association encoding logic diagram. Source: Illustratration by the authors
Abbreviations: BE: Built environment; LTPA: Leisure-time physical activity.
Table 3. Associated coding standards
Percentages of records supporting association Summary code Description
0 – 39% associated 0 Evidence unrelated
40 – 50% associated in one direction and ≥25% in the opposite 0 Evidence unrelated
40 – 50% associated in one direction and <25% in the opposite (+); (-) Possible evidence for a positive/negative association
51 – 100% associated in one direction and ≥25% in the opposite (+); (-) Possible evidence for a positive/negative association
51 – 100% associated in one direction and <25% in the opposite +; - Convincing evidence for a positive/negative association
Note: (i) Only valid when the association was investigated in at least three independent samples; otherwise, evidence was regarded as “not applicable”
(coded as “N/A”). (ii) Double -signed summary codes are applied when convincing positive “+,” convincing negative “-,” possible positive “(+),” possible
negative “(−),” or no associations “0” were present in at least three independent studies.
Table 4. Quality assessment of the included articles
a Representativeness b Confounder c Data collection d Results
Response rate Individual level BE level BE measures LTPA measures Analytical Approach
2: “≥60%”; 1: “41–60%”; 2: “individual 2: “Participants 2: “validated questionnaire 2: “validated questionnaire 2: “Analyses
0: “≤40% or not known” attributes”; 0: recruitment stratified or clearly described or clearly described conducted and
“not met or not by environmental objective measures”; 1: objective measures”; 1: “self- presented correctly”;
known” attributes”; 0: “not met “self-reported or not yet reported or not yet validated 1: “not yet validated
or not known” validated or established in or established in the field”; or established in the
the field”; 0: “not met or 0: “not met or not known” field”; 0: “not met or
not known” not known”
Note 1: Criteria (a) What is the response rate?; (b) Were confounders controlled?; (c) Are valid, reliable, or standardized measures used for the outcome
measure?; (d) Were the included studies analyzed and presented correctly (e.g., confidence intervals, p-values indicated)?
Note 2: Rating: “2”: strong; “1”: moderate; “0”: weak. Global rating: “Good”: no weak ratings; “Fair”: 1 weak rating; “Poor”: 2 or more weak ratings.
indicating confidence intervals and p-values). Next, we 3. Results
categorized the quality of the studies as “good,” “fair,” or
“poor” based on the number of articles that met the above 3.1. Study description
criteria. Specifically, articles that did not receive a “weak” 3.1.1. Article selection results
rating were classified as good quality. Those receiving one
“weak” rating were categorized as fair quality, while articles As of June 2023, we retrieved 486 subject-related
with two or more “weak” scores were classified as poor publications. After removing duplicates and filtering
quality. articles based on title and abstract, 81 studies remained.
Volume 6 Issue 2 (2024) 8 https://doi.org/10.36922/jcau.2427