
Page 55 - JCBP-2-3
P. 55
Journal of Clinical and
Basic Psychosomatics Proteomic analysis of mind-body psychotherapy in psoriasis
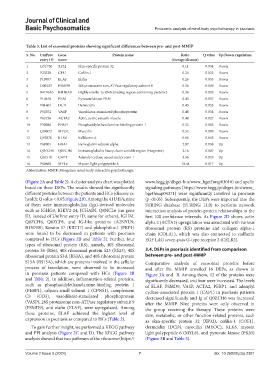
Table 3. List of exosomal proteins showing significant differences between pre‑ and post‑MMIP
S. No. UniProt Gene Protein name Ratio Q value Up/Down‑regulation
entry ID name (therapy/disease)
1 Q5T750 XP32 Skin-specific protein 32 0.11 0.034 Down
2 P23528 CFL1 Cofilin-1 0.24 0.023 Down
3 P19957 ELAF Elafin 0.26 0.035 Down
4 O00233 PSMD9 26S proteasome non-ATPase regulatory subunit 9 0.36 0.049 Down
5 B4DRA0 B4DRA0 Highly similar to RNA-binding region-containing protein 2 0.36 0.039 Down
6 P14618 PKM Pyruvate kinase PKM 0.43 0.037 Down
7 P81605 DCD Dermcidin 0.43 0.033 Down
8 P50552 VASP Vasodilator-stimulated phosphoprotein 0.48 0.034 Down
9 P62736 ACTA2 Actin, aortic smooth muscle 0.49 0.027 Down
10 P30086 PEBP1 Phosphatidylethanolamine-binding protein 1 0.52 0.005 Down
11 Q99972 MYOC Myocilin 0.52 0.009 Down
12 Q92876 KLK6 Kallikrein-6 0.66 0.042 Down
13 P69905 HBA1 Hemoglobin subunit alpha 2.07 0.038 Up
14 Q0ZCH6 Q0ZCH6 Immunoglobulin heavy chain variable region (Fragment) 2.16 0.007 Up
15 Q01518 CAP1 Adenylyl cyclase-associated protein 1 3.56 0.025 Up
16 P60660 MYL6 Myosin light polypeptide 6 10.44 0.017 Up
Abbreviation: MMIP: Mongolian mind-body interactive psychotherapy.
(Figure 2A and Table 2). A cluster analysis chart was plotted www.kegg.jp/dbget-bin/www_bget?map03010) and apelin
based on these DEPs. The results showed the significantly signaling pathways (https://www.kegg.jp/dbget-bin/www_
different proteins between the patients and HCs (disease vs. bget?map04371) were significantly involved in psoriasis
health; Q value < 0.05; Figure 2B). Among the 41 DEPs, nine (p <0.05). Subsequently, the DEPs were imported into the
of them were immunoglobulins (Igs)-derived molecules STRING database (STRING 11.0) to perform network
such as IGHG3, IGKV2-24, JCHAIN, Q8NCL6 (no gene interaction analysis of protein-protein relationships in the
ID, instead of UniProt entry ID, same for others), IGHM, first 100 confidence intervals. As Figure 2D shows, actin
Q0ZCH6, Q0ZCF6, and IG-like proteins (A2NYU9, alpha 2 (ACTA2) upregulation was associated with various
B1N7B9). Keratin 17 (KRT17) and plakophilin-1 (PKP1) ribosomal protein (RS) proteins and collagen alpha-1
were found to be decreased in patients with psoriasis chain (COLA1), which was also connected to cadherin
compared to HCs (Figure 2B and Table 2). Further, four EGF LAG seven-pass G-type receptor 2 (CELR2).
types of ribosomal protein (RS), namely, 40S ribosomal
protein S6 (RS6), 40S ribosomal protein S23 (RS23), 40S 3.4. DEPs in psoriasis identified from comparison
ribosomal protein S3A (RS3A), and 40S ribosomal protein between pre- and post-MMIP
S15A (RS15A), which are proteins involved in the cellular Comparative analysis of exosomal proteins before
process of translation, were observed to be increased and after the MMIP unveiled 16 DEPs, as shown in
in psoriasis patients compared with HCs (Figure 2B Figure 3A and B. Among them, 12 of the proteins were
and Table 2). In addition, inflammation-related proteins, significantly decreased, and four were increased. The levels
such as phosphatidylethanolamine-binding protein 1 of ELAF, PSMD9, VASP, ACTA2, PEBP1, and adenylyl
(PEBP1), calpain small subunit 1 (CPNS1), complement cyclase-associated protein 1 (CAP1) in psoriasis patients
C3 (CO3), vasodilator-stimulated phosphoprotein decreased significantly and Ig of Q0ZCH6 was increased
(VASP), 26S proteasome non-ATPase regulatory subunit 9 after the MMIP. Nine proteins were only observed in
(PSMD9), and elafin (ELAF), were upregulated. Among the group receiving the therapy. These proteins were
these proteins, ELAF achieved the highest level of skin, metabolic, or other function-related proteins, such
expression in psoriasis as compared to HCs (Table 2). as skin-specific protein 32 (XP32), cofilin-1 (COF1),
To gain further insight, we performed a KEGG pathway dermcidin (DCD), myocilin (MYOC), KLK6, myosin
and PPI analysis (Figure 2C and D). The KEGG pathway light polypeptide 6 (MYL6), and pyruvate kinase (PKM)
analysis showed that two pathways of the ribosome (https:// (Figure 3B and Table 3).
Volume 2 Issue 3 (2024) 7 doi: 10.36922/jcbp.2381