
Page 50 - JCTR-10-1
P. 50
46 Gonda et al. | Journal of Clinical and Translational Research 2024; 10(1): 33-51
Supplementary Data 3
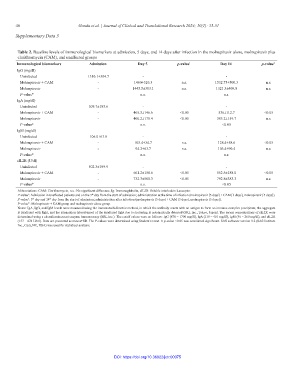
Table 2. Baseline levels of immunological biomarkers at admission, 5 days, and 14 days after infection in the molnupiravir alone, molnupiravir plus
clarithromycin (CAM), and unaffected groups
Immunological biomarkers Admission Day 5 p‑value 1 Day 14 p‑value 2
IgG (mg/dl)
Uninfected 1310.1±304.7 - -
Molnupiravir + CAM - 1460±326.3 n.s. 1532.75±500.3 n.s.
Molnupiravir - 1445.5±303.1 n.s. 1321.3±409.8 n.s.
P-value* n.s. n.s.
IgA (mg/dl)
Uninfected 509.7±183.6 - -
Molnupiravir + CAM - 465.3±146.6 <0.05 536±112.7 <0.05
Molnupiravir - 400.2±178.4 <0.05 385.2±159.7 n.s.
P-value* n.s. <0.05
IgM (mg/dl)
Uninfected 106.0±63.8 - -
Molnupiravir + CAM - 105.4±34.7 n.s. 128.4±58.6 <0.05
Molnupiravir - 94.2±63.7 n.s. 103.4±90.4 n.s.
P-value* n.s. n.s.
sIL2R (U/dl)
Uninfected 502.3±199.9 - -
Molnupiravir + CAM - 661.2±158.6 <0.05 552.5±188.0 <0.05
Molnupiravir - 732.3±500.3 <0.05 792.8±383.3 n.s.
P-value* n.s. <0.05
Abbreviations: CAM: Clarithromycin, n.s.: No significant difference, Ig: Immunoglobulin, sIL2R: Soluble interleukin 2-receptor.
P-value : Admission in unaffected patients and on the 5 day from the start of admission; administration at the time of infection (molnupiravir [5 days] + CAM [3 days], molnupiravir [5 days]).
1
th
P-value : 5 day and 14 day from the start of admission; administration after infection (molnupiravir [5 days] + CAM [3 days], molnupiravir [5 days]).
th
th
2
P-value*: Molnupiravir + CAM group and molnupiravir alone group.
Notes: IgA, IgG, and IgM levels were measured using the immunoturbidimetric method, in which the antibody reacts with an antigen to form an immune complex precipitate; the aggregate
is irradiated with light, and the attenuation (absorbance) of the irradiated light due to scattering is automatically detected (SRL Inc., Tokyo, Japan). The serum concentrations of sIL2R were
determined using a chemiluminescent enzyme immunoassay (SRL Inc.). The cutoff values were as follows: IgG (870 – 1700 mg/dl), IgA (110 – 410 mg/dl), IgM (46 – 260 mg/dl), and sIL2R
(157 – 474 U/ml). Data are presented as means±SD. The P-values were determined using Student’s t-test. A p-value <0.05 was considered significant. SAS software version 9.2 (SAS Institute
Inc., Cary, NC, USA) was used for statistical analysis.
DOI: https://doi.org/10.36922/jctr.00075