
Page 40 - JCTR-10-3
P. 40
214 Rando et al. | Journal of Clinical and Translational Research 2024; 10(3): 212-218
100 mmHg, which mimics the right ventricular overload seen repeated. After all rotations were completed, the average of all
in FTR from left-sided valvular pathology. Right ventricular 100 tenting volumes was calculated to generate a final result.
pressure was sustained at 100 mmHg for 3 h, with the intent
of creating progressive annular and ventricular enlargement 2.5. Clinical validation
and inducing FTR. Throughout the 3-h period of sustained right To compare the native geometry of the swine and human
ventricle pressurization, hydration of the tissues was ensured by tricuspid valve and to validate the FTR model, the ex vivo native
periodically adding a small amount of fluid to the right ventricle, and FTR models were compared to publishe transesophageal
thus humidifying the air and maintaining the integrity of the echocardiographic (TEE) measurements from non-diseased
tricuspid valve complex. Dampened towels were also applied to (control) and FTR patients. Publications were selected if their
the exterior surface of the heart. After 3 h, the right atrium was methodology was well-described, and measurements were
excised to allow for optimal visualization of the tricuspid valve sampled in planes similar to those described above [11-13].
apparatus, and the tricuspid valve was imaged in its regurgitant
state with the 3D light scanner (Figure 2C). 2.6. Statistical analysis
2.4. Outcomes Comparisons were first made between the native and
regurgitant ex vivo model and subsequently between the ex
The primary outcomes of interest were tricuspid annular vivo model and in vivo echocardiographic data. Non-parametric
dimensions, including annular circumference, diameter, and testing was considered given the small sample size, but non-
area. Secondary outcomes were measures of leaflet geometry, parametric comparisons between the ex vivo model and in vivo
including tenting height, angle, and area. For the model of echocardiographic data were not possible as we did not have
FTR, the effective regurgitant orifice area was also measured access to the underlying data sets for literature reported in vivo
and was defined as the area of visible malcoaptation. The echocardiographic data. We instead verified the normality of our
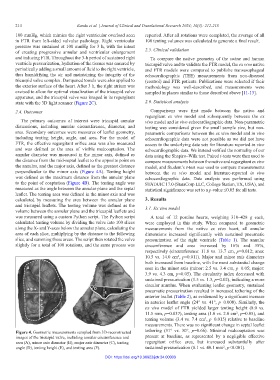
annular diameter was measured in the minor axis, defined as data using the Shapiro–Wilk test. Paired t-tests were then used to
the distance from the mid-septal leaflet to the opposite point on compare measurements between the native and regurgitant ex vivo
the annulus, and the major axis, defined as the greatest distance model, and Student’s t-test was used to compare measurements
perpendicular to the minor axis (Figure 4A). Tenting height between the ex vivo model and literature-reported in vivo
was defined as the maximum distance from the annular plane echocardiographic data. Data analysis was performed using
to the point of coaptation (Figure 4B). The tenting angle was STATA/IC 17.0 (StataCorp LLC, College Station, TX, USA), and
measured as the angle between the annular plane and the septal statistical significance was set to a p-value ≤0.05 for all tests.
leaflet. The tenting area was defined in the minor axis and was
calculated by measuring the area between the annular plane 3. Results
and tricuspid leaflets. The tenting volume was defined as the 3.1. Ex vivo model
volume between the annular plane and the tricuspid leaflets and
was measured using a custom Python script. The Python script A total of 12 porcine hearts, weighing 310–428 g each,
calculated tenting volume by dividing the valve into 100 slices were employed in this study. When compared to geometric
along the X- and Y-axes below the annular plane, calculating the measurements from the native ex vivo heart, all annular
area of each slice, multiplying by the distance to the following dimensions increased significantly with sustained pneumatic
slice, and summing these areas. The script then rotated the valve pressurization of the right ventricle (Table 1). The annular
slightly for a total of 100 rotations, and the same process was circumference and area increased by 16% and 35%,
respectively (circumference: 11.8 vs. 13.7 cm, p=0.012; area:
10.5 vs. 14.0 cm , p=0.011). Major and minor axis diameters
2
both increased from baseline, with the most substantial change
seen in the minor axis (minor: 2.5 vs. 3.4 cm, p=0.05; major:
3.9 vs. 4.3 cm, p=0.05). The circularity index decreased with
sustained pressurization (1.5 vs. 1.3, p=0.02), indicating a more
circular annulus. When evaluating leaflet geometry, sustained
pneumatic pressurization resulted in increased tethering of the
anterior leaflet (Table 2), as evidenced by a significant increase
in anterior leaflet angle (24° vs. 41°, p=0.008). Similarly, the
ex vivo model of FTR yielded larger tenting height (8.0 vs.
11.5 mm, p=0.037), tenting area (1.0 vs. 2.0 cm , p=0.05), and
2
tenting volume (3.4 vs. 7.4 cm , p=0.015) relative to baseline
3
measurements. There was no significant change in septal leaflet
Figure 4. Geometric measurements sampled from 3D-reconstructed tethering (31° vs. 30°, p=0.66). Minimal malcoaptation was
images of the tricuspid valve, including annular circumference and present at baseline, as represented by a negligible effective
area (A), minor axis diameter (B), major axis diameter (C), tenting regurgitant orifice area, but increased substantially after
2
angle (D), tenting height (E), and tenting area (F). sustained pressurization (8.1 vs. 40.1 mm , p<0.001).
DOI: https://doi.org/10.36922/jctr.24.00003