
Page 41 - JCTR-10-3
P. 41
Rando et al. | Journal of Clinical and Translational Research 2024; 10(3): 212-218 215
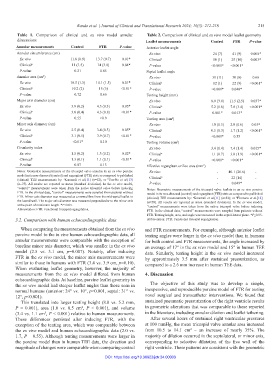
Table 1. Comparison of clinical and ex vivo model annular Table 2. Comparison of clinical and ex vivo model leaflet geometry
dimensions Leaflet measurements Control FTR P‑value
Annular measurements Control FTR P‑value Anterior leaflet angle
Annular circumference (cm) Ex vivo 24 (7) 41 (9) 0.008*
Ex vivo 11.8 (0.9) 13.7 (0.7) 0.01* Clinical a 10 (1) 25 (10) 0.003*
Clinical a 11 (1.5) 14 (3.8) 0.04* P-value <0.001* <0.001*
P-value 0.21 0.85 Septal leaflet angle
Annular area (cm ) Ex vivo 31 (11) 30 (6) 0.66
2
Ex vivo 10.5 (1.3) 14.1 (1.5) 0.01* Clinical a 12 (1) 22 (9) <0.001*
Clinical a 10.2 (2) 15 (5) <0.01* P-value <0.001* 0.040*
P-value 0.72 0.66 Tenting height (mm)
Major axis diameter (cm) Ex vivo 8.0 (3.0) 11.5 (2.5) 0.037*
Ex vivo 3.9 (0.2) 4.3 (0.3) 0.05* Clinical a 5.2 (1.8) 7.8 (3.4) <0.001*
Clinical a 3.8 (0.4) 4.3 (0.8) <0.01* P-value 0.001* 0.013*
P-value 0.55 >0.9 Tenting area (cm )
2
Minor axis diameter (cm) Ex vivo 1.0 (0.5) 2.0 (0.6) 0.05*
Ex vivo 2.5 (0.4) 3.4 (0.5) 0.05* Clinical a 0.5 (0.3) 1.7 (1.2) <0.001*
Clinical a 3.1 (0.5) 3.9 (0.7) <0.01* P-value <0.001* 0.55
P-value <0.01* 0.10 Tenting volume (cm )
3
Circularity index Ex vivo 3.4 (1.4) 7.4 (1.4) 0.015*
Ex vivo 1.5 (0.2) 1.3 (0.2) 0.02* Clinical a 1.1 (0.7) 3.0 (1.9) <0.001*
Clinical b 1.3 (0.1) 1.1 (0.1) <0.01* P-value <0.001* <0.001*
P-value 0.07 0.13 Effective regurgitant orifice area (mm )
2
Notes: Geometric measurements of the tricuspid valve annulus in an ex vivo porcine Ex vivo - 40.1 (26.6) -
model in its non-diseased (control) and regurgitant (FTR) state as compared to published Clinical b - 22 (14) -
(clinical) TEE measurements by: Karamali et al.[11] (n=52); or Ton-Nu et al.[13]
a
b
(n=75). All results are reported as mean (standard deviation). In the ex vivo model, P-value - 0.049*
“control” measurements were taken from the native tricuspid valve before inducing Notes: Geometric measurements of the tricuspid valve leaflets in an ex vivo porcine
FTR. In the clinical data, “control” measurements were sampled from patients without model in its non-diseased (control) and regurgitant (FTR) state as compared to published
FTR. Minor axis diameter was measured as a normal line from the mid-septal leaflet to (clinical) TEE measurements by: Karamali et al.[11] (n=52); or Florescu et al.[12]
a
b
the lateral wall. The major axis diameter was measured perpendicular to the minor axis (n=58). All results are reported as mean (standard deviation). In the ex vivo model,
at the point of maximum length. *P≤0.05. “control” measurements were taken from the native tricuspid valve before inducing
Abbreviation: FTR: Functional tricuspid regurgitation. FTR. In the clinical data, “control” measurements were sampled from patients without
FTR. Tenting height, area, and angle were measured in the septal-lateral plane. *P≤0.05.
3.2. Comparison with human echocardiographic data Abbreviation: FTR: Functional tricuspid regurgitation.
When comparing the measurements obtained from the ex vivo and FTR measurements. For example, although anterior leaflet
porcine model to the in vivo human echocardiographic data, all tenting angles were larger in the ex vivo model than in humans
annular measurements were comparable with the exception of for both control and FTR measurements, the angle increased by
baseline minor axis diameter, which was smaller in the ex vivo an average of 17° in the ex vivo model and 15° in human TEE
model (2.5 vs. 3.1 cm, p=0.007). Notably, after inducing data. Similarly, tenting height in the ex vivo model increased
FTR in the ex vivo model, the minor axis measurements were by approximately 3.5 mm after sustained pressurization, as
similar to those in humans with FTR (3.4 vs. 3.9 cm, p=0.10). compared to a 2.6 mm increase in human TEE data.
When evaluating leaflet geometry, however, the majority of
measurements from the ex vivo model differed from human 4. Discussion
echocardiographic data. At baseline, porcine leaflet geometry in
the ex vivo model had steeper leaflet angles than those seen in The objective of this study was to develop a simple,
normal humans (anterior: 24° vs. 10°, p<0.001, septal: 31° vs. inexpensive, and reproducible porcine model of FTR for testing
12°, p<0.001). novel surgical and transcatheter interventions. We found that
This translated into larger tenting height (8.0 vs. 5.2 mm, sustained pneumatic pressurization of the right ventricle results
P = 0.001), area (1.0 vs. 0.5 cm , P < 0.001), and volume in geometric alterations that was comparable to those reported
2
(3.4 vs. 1.1 cm , P < 0.001) relative to human measurements. in the literature, including annular dilation and leaflet tethering.
3
These differences persisted after inducing FTR, with the After several hours of sustained right ventricular pressures
exception of the tenting area, which was comparable between at 100 mmHg, the mean tricuspid valve annular area increased
2
the ex vivo model and human echocardiographic data (2.0 vs. from 10.5 to 14.1 cm – an increase of nearly 35%. The
1.7, P = 0.55). Although tenting measurements were larger in majority of dilation occurred in the septolateral, or minor axis,
the porcine model than in human TEE data, the direction and corresponding to selective dilatation of the free wall of the
magnitude of changes were comparable when comparing control right ventricle. These patterns are consistent with the geometric
DOI: https://doi.org/10.36922/jctr.24.00003