
Page 66 - JCTR-11-1
P. 66
Journal of Clinical and
Translational Research Osteoporosis risk factors in diabetics
Table 2. Correlation of various factors with the T-scores
Parameter T-scores
Lumbar vertebra Right femur Left femur
r P r P r P
BMI (kg/m ) −0.271** 0 0.244** 0 0.154* 0.028
2
WHR −0.275** 0 0.249** 0 0.180* 0.01
Duration of T2DM (years) −0.031 0.662 −0.035 0.619 −0.043 0.538
Age (years) −0.004 0.952 −0.141* 0.044 −0.129 0.066
HbA1C (%) −0.168* 0.017 0.151* 0.031 0.137 0.051
Serum calcium (mg/dL) −0.034 0.631 0.066 0.352 0.084 0.234
Serum creatinine (mg/dL) −0.142* 0.044 −0.147* 0.036 −0.181** 0.01
Serum urea (mg/dL) −0.051 0.467 0.084 0.233 0.121 0.085
Urine ACR (mg/g) −0.089 0.205 −0.002 0.982 0.045 0.52
TSH (mIU/L) 0.046 0.514 −0.018 0.801 −0.043 0.545
Menopause duration (years) 0.148 0.145 −0.305** 0.002 −0.315** 0.002
Vitamin D (g/mL) 0.054 0.751 0.131 0.44 0.078 0.646
FRAX score
Right hip (%) 0.395** 0 −0.665** 0 −0.614** 0
Left hip (%) 0.389** 0 −0.593** 0 −0.675** 0
Note: ** Correlation is significant at the 0.01 level (two-tailed); *correlation is significant at the 0.05 level (two-tailed); r denotes Pearson correlation;
p denotes significance.
Abbreviations: BMI: Body mass index; HER: Waist-to-hip ratio; T2DM: Type 2 diabetes mellitus; ACR: Albumin-creatinine ratio; TSH: Thyroid-
stimulating hormone.
Table 3. Risk assessment with FRAX
FRAX Females Males Total OR 95% Confidence
interval
n % n % Lower Upper
Right hip
>3 25 25.25 16 15.38 41 1.86 0.923 3.740
<3 74 74.74 88 84.61 - - - -
Left hip
>3 36 36.36 17 16.34 53 2.9 1.442 5.433
<3 63 63.63 87 83.65 - - - -
Total 99 - 104 - - - - -
Abbreviation: OR: Odds ratio.
Increased microRNA-151a-3p levels in postmenopausal
women promote osteoclast differentiation and affect BMD
by targeting the suppressor of cytokine signaling 5 and
activating the JAK2/STAT3 signaling pathway. 20,21
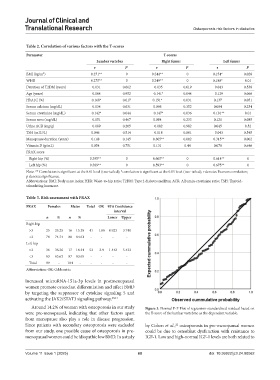
Around 14.2% of women with osteoporosis in our study Figure 3. Normal P-P Plot of regression-standardized residual based on
were pre-menopausal, indicating that other factors apart the T-score of the lumbar vertebrae as the dependent variable.
from menopause also play a role in disease progression.
Since patients with secondary osteoporosis were excluded by Cohen et al., osteoporosis in pre-menopausal women
22
from our study, one possible cause of osteoporosis in pre- could be due to osteoblast dysfunction with resistance to
menopausal women could be idiopathic low BMD. In a study IGF-1. Low and high-normal IGF-1 levels are both related to
Volume 11 Issue 1 (2025) 60 doi: 10.36922/jctr.24.00062