
Page 67 - JCTR-11-1
P. 67
Journal of Clinical and
Translational Research Osteoporosis risk factors in diabetics
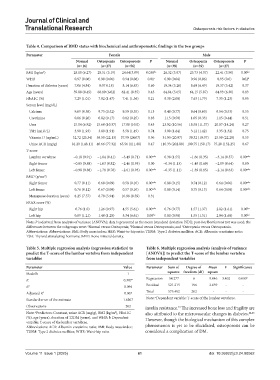
Table 4. Comparison of BMD status with biochemical and anthropometric findings in the two groups
Parameter Female Male
Normal Osteopenia Osteoporosis P Normal Osteopenia Osteoporosis P
(n=16) (n=27) (n=56) (n=38) (n=39) (n=27)
2
BMI (kg/m ) 28.10 (6.27) 28.51 (5.19) 24.64(3.99) 0.038 b,c 26.32 (3.97) 25.73 (4.37) 22.41 (3.50) 0.00 b,c
WHR 0.97 (0.06) 0.98 (0.06) 0.94 (0.06) 0.01 c 0.99 (0.06) 0.96 (0.06) 0.95 (0.0) 0.02 b
Duration of diabetes (years) 7.06 (4.84) 9.07 6.18) 8.14 (6.83) 0.60 10.34 (5.26) 8.69 (6.49) 10.37 (5.42) 0.37
Age (years) 59.88 (8.45) 60.89 (6.02) 62.41 (8.35) 0.45 64.84 (5.65) 64.15 (5.87) 64.93 (6.30) 0.83
HbA1C (%) 7.29 (1.01) 7.92 (1.47) 7.41 (1.36) 0.21 8.38 (2.08) 7.63 (1.79) 7.35 (1.23) 0.05
Serum level (mg/dL)
Calcium 9.69 (0.58) 9.75 (0.52) 9.50 (0.55) 0.13 9.48 (0.77) 9.64 (0.60) 9.54 (0.53) 0.55
Creatinine 0.86 (0.20) 0.82 (0.17) 0.82 (0.25) 0.85 1.15 (0.50) 1.05 (0.33) 1.15 (0.44) 0.51
Urea 15.04 (6.92) 15.68 (10.37) 17.98 (10.0) 0.43 23.02 (10.56) 18.58 (11.37) 20.87 (14.24) 0.27
TSH (mIU/L) 3.90 (1.93) 3.80 (1.91) 3.58 (1.49) 0.74 3.09 (1.64) 3.12 (1.42) 3.35 (1.32) 0.75
Vitamin D (ng/mL) 32.72 (25.34) 38.50 (22.13) 37.90 (24.07) 0.96 31.03 (20.97) 39.32 (19.97) 25.59 (22.29) 0.53
Urine ACR (mg/g) 81.20 (148.11) 40.66 (77.32) 65.56 (111.88) 0.47 110.33 (202.88) 109.75 (159.17) 75.20 (152.25) 0.67
T-score
Lumbar vertebrae −0.18 (0.91) −1.84 (0.41) −3.49 (0.71) 0.00 a,b,c 0.38 (1.55) −1.66 (0.35) −3.14 (0.57) 0.00 a,b,c
Right femur −0.85 (0.88) −1.63 (0.82) −2.46 (0.93) 0.00 −0.34 (1.13) −1.49 (0.69) −2.09 (0.64) 0.00
Left femur −0.98 (0.88) −1.78 (0.78) −2.61 (0.93) 0.00 a,b,c −0.35 (1.11) −1.39 (0.85) −2.14 (0.63) 0.00 a,b,c
BMD (g/cm )
2
Right femur 0.77 (0.11) 0.68 (0.09) 0.58 (0.10) 0.00 a,b,c 0.88 (0.15) 0.74 (0.12) 0.64 (0.06) 0.00 a,b,c
Left femur 0.76 (0.12) 0.67 (0.09) 0.57 (0.10) 0.00 a,b,c 0.88 (0.14) 0.75 (0.13) 0.64 (0.08) 0.00 a,b,c
Menopause duration (years) 8.25 (7.57) 8.78 (5.94) 10.98 (8.59) 0.31
FRAX score (%)
Right hip 0.76 (1.0) 1.26 (0.97) 4.55 (5.61) 0.00 a,b,c 0.76 (0.77) 1.57 (1.37) 2.82 (1.61) 0.00 b,c
Left hip 0.89 (1.21) 1.48 (1.28) 5.34 (6.61) 0.00 b,c 0.80 (0.98) 1.55 (1.51) 2.94 (1.68) 0.00 b,c
Note: P is derived from analysis of variance (ANOVA); data is presented as the mean (standard deviation [SD]); post-hoc Bonferroni test was used; the
differences between the subgroups were: Normal versus Osteopenia; Normal versus Osteoporosis; and Osteopenia versus Osteoporosis.
b
a
c
Abbreviations: Abbreviations: BMI: Body mass index; HER: Waist-to-hip ratio; T2DM: Type 2 diabetes mellitus; ACR: Albumin-creatinine ratio;
TSH: Thyroid stimulating hormone; BMD: Bone mineral density.
Table 5. Multiple regression analysis (regression statistics) to Table 6. Multiple regression analysis (analysis of variance
predict the T-score of the lumbar vertebra from independent [ANOVA]) to predict the T-score of the lumbar vertebra
variables from independent variables
Parameter Value Parameter Sum of Degree of Mean F Significance
Modelb 1 squares freedom (df) square
R 0.307 a Regression 54.277 6 9.046 3.402 0.003 a
R 2 0.094 Residual 521.215 196 2.659 - -
Adjusted R 2 0.067 Total 575.492 202 - - -
a
Standard error of the estimate 1.6307 Note: Dependent variable: T-score of the lumbar vertebrae.
Observations 202 insulin resistance. The increased bone loss and fragility are
23
Note: Predictors: Constant, urine ACR (mg/g), BMI (kg/m ), HbA1C also attributed to the microvascular changes in diabetes. 24,25
2
a
(%), age (years), duration of T2DM (years), and WHR; b Dependent However, though the biological mechanism of this complex
variable: T-score of the lumbar vertebrae.
Abbreviations: ACR: Albumin-creatinine ratio; BMI: Body mass index; phenomenon is yet to be elucidated, osteoporosis can be
T2DM: Type 2 diabetes mellitus; WHR: Waist-hip ratio. considered a complication of DM.
Volume 11 Issue 1 (2025) 61 doi: 10.36922/jctr.24.00062