
Page 65 - JCTR-11-4
P. 65
Journal of Clinical and
Translational Research AR-TAVR coaxiality assessment using 3DP
Table 4. Predictors of paravalvular leakage grade ≥mild
Characteristics Univariate analysis Multivariate analysis
OR 95% CI p‑value OR 95% CI p‑value
BMI ≥30 kg/m 2 1.12 1.03 – 1.21 0.010* - - -
STS ≥10% 1.31 0.73 – 2.28 0.028* - - -
V 1.07 1.03 – 1.42 0.023* - - -
max
Severe aortic regurgitation 0.68 0.45 – 1.04 0.037* - - -
AA diameter ≥41 mm 0.96 0.91 – 1.14 0.012* - - -
Horizocardia 1.23 0.83 – 1.83 <0.001*** 1.24 1.16 – 1.33 <0.001***
LCH 1.11 1.06 – 1.16 <0.001*** - - -
Coaxial angle 3.55 2.82 – 4.46 <0.001*** 4.28 3.06 – 6.00 <0.001***
LCC depth 1.20 1.13 – 1.27 <0.001*** - - -
Coaxiality index 3.22 2.66 – 3.9 <0.001*** 9.45 4.40 – 20.28 <0.001***
3DP group versus non-3DP group 0.26 0.18 – 0.39 <0.001*** 0.18 0.07 – 0.48 0.001**
Notes: Odd ratios and p-values are derived from logistic regression analyses. *p<0.05, **p<0.01, ***p<0.001.
Abbreviations: AA: Ascending aorta; BMI: Body mass index; CI: Confidence interval; LCC: Left coronary cusp; LCH: Left coronary artery height;
OR: Odds ratio; STS: Society of Thoracic Surgeons; Vmax: Peak flow velocity of aortic valve; 3DP: Three-dimensional printing.
A B
C D
E F
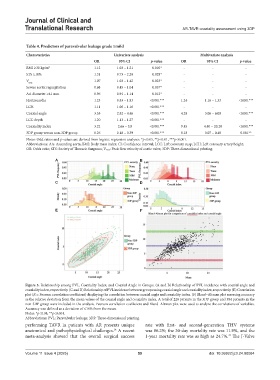
Figure 5. Relationship among PVL, Coaxiality Index, and Coaxial Angle in Groups. (A and B) Relationship of PVL incidence with coaxial angle and
coaxiality index, respectively. (C and D) Relationship of PVL incidence between groups using coaxial angle and coaxiality index, respectively. (E) Correlation
plot (R = Pearson correlation coefficient) displaying the correlation between coaxial angle and coaxiality index. (F) Bland–Altman plot assessing accuracy
as the relative deviation from the mean values of the coaxial angle and coaxiality index. A total of 228 patients in the 3DP group and 384 patients in the
non-3DP group were included in the analysis. Pearson correlation coefficient and Bland–Altman plot were used to analyze the correlations of variables.
Accuracy was defined as a deviation of ≤10% from the mean.
Notes: *p<0.01; **p<0.001.
Abbreviations: PVL: Paravalvular leakage; 3DP: Three-dimensional printing.
performing TAVR in patients with AR presents unique rate with first- and second-generation THV systems
anatomical and pathophysiological challenges. A recent was 86.2%; the 30-day mortality rate was 11.9%, and the
14
meta-analysis showed that the overall surgical success 1-year mortality rate was as high as 24.7%. The J-Valve
22
Volume 11 Issue 4 (2025) 59 doi: 10.36922/jctr.24.00084