
Page 62 - JCTR-11-4
P. 62
Journal of Clinical and
Translational Research AR-TAVR coaxiality assessment using 3DP
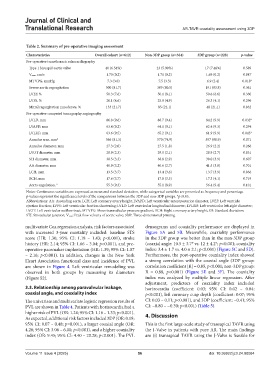
Table 2. Summary of pre‑operative imaging assessment
Characteristics Overall cohort (n=612) Non‑3DP group (n=384) 3DP group (n=228) p‑value
Pre-operative transthoracic echocardiography
Type 1 bicuspid aortic valve 40 (6.54%) 23 (5.99%) 17 (7.46%) 0.589
Vmax, cm/s 1.70 (0.2) 1.71 (0.2) 1.69 (0.2) 0.847
MTVPG, mmHg 7.3 (3.0) 7.5 (3.3) 6.9 (2.4) 0.018*
Severe aortic regurgitation 500 (81.7) 309 (80.5) 191 (83.8) 0.361
LVEF, % 50.3 (7.6) 50.1 (8.1) 50.6 (6.6) 0.330
LVFS, % 26.1 (4.6) 25.9 (4.9) 26.3 (4.1) 0.296
Mitral regurgitation ≥moderate, % 133 (21.7) 85 (22.1) 48 (21.1) 0.832
Pre-operative computed tomography angiography
LVLD, mm 86.8 (9.6) 88.7 (9.4) 84.2 (9.9) 0.032*
LVAPD, mm 63.4 (9.2) 64.1 (9.1) 62.4 (9.3) 0.294
LVLRD, mm 63.6 (9.5) 65.2 (9.1) 61.9 (9.9) 0.043*
Annulus area, mm 2 566 (81.3) 570 (74.9) 557 (88.9) 0.071
Annulus diameter, mm 27.3 (2.0) 27.5 (1.8) 26.9 (2.2) 0.266
LVOT diameter, mm 28.9 (2.3) 29.0 (2.1) 28.9 (2.7) 0.831
STJ diameter, mm 38.5 (3.3) 38.8 (2.9) 38.0 (3.9) 0.607
AA diameter, mm 40.9 (3.2) 40.6 (2.7) 41.5 (3.8) 0.701
LCH, mm 13.5 (3.7) 13.4 (3.6) 13.7 (3.9) 0.836
RCH, mm 17.6 (3.7) 17.8 (3.5) 17.3 (4.1) 0.719
Aorta angulation, ° 55.3 (9.3) 55.1 (8.9) 56.4 (9.4) 0.101
Notes: Continuous variables are expressed as mean and standard deviation, while categorical variables are presented as frequency and percentage.
p-values represent the significance levels of the comparisons between the 3DP and non-3DP groups. *p<0.05.
Abbreviations: AA: Ascending aorta; LCH: Left coronary artery height; LVAPD: Left ventricular anteroposterior diameter; LVEF: Left ventricle
ejection fraction; LVFS: Left ventricular fraction shortening; LVLD: Left ventricular longitudinal diameter; LVLRD: Left ventricular left-right diameter;
LVOT: Left ventricular outflow tract; MTVPG: Mean transvalvular pressure gradient; RCH: Right coronary artery height; SD: Standard deviation;
STJ: Sinotubular junction; Vmax: Peak flow velocity of aortic valve; 3DP: Three-dimensional printing.
multivariate Cox regression analysis, risk factors associated densograms and coaxiality performance are displayed in
with increased 3-year mortality included: baseline STS Figure 5A and 5B. Meanwhile, coaxiality performance
score (HR: 1.30; 95% CI: 1.18 – 1.43; p<0.001), stroke in the 3DP group was better than in the non-3DP group
history (HR: 2.14; 95% CI: 1.66 – 3.04; p<0.001), and pre- (coaxial angle: 10.5 ± 3.7° vs. 12 ± 4.2°; p<0.001; coaxiality
operative pacemaker implantation (HR: 1.39; 95% CI: 1.07 index: 3.4 ± 1.7 vs. 4.0 ± 2.1; p<0.001) (Figure 5C and 5D).
– 2.16; p<0.001). In addition, changes in the New York Furthermore, the post-operative coaxiality index showed
Heart Association functional class and incidence of PVL a strong correlation with the coaxial angle (3DP group:
are shown in Figure 4. Left ventricular remodeling was correlation coefficient [R] = 0.85, p<0.001; non-3DP group:
observed in both groups by measuring its diameters R = 0.88, p<0.001) (Figure 5E and 5F). The coaxiality
(Figure S2). index was analyzed by multiple linear regression. After
adjustment, predictors of coaxiality index included
3.3. Relationship among paravalvular leakage, horizocardia (coefficient: 0.03; 95% CI: 0.02 – 0.04;
coaxial angle, and coaxiality index p<0.001), left coronary cusp depth (coefficient: 0.07; 95%
The univariate and multivariate logistic regression results of CI: 0.03 – 0.11; p<0.001), and 3DP (coefficient: −0.41; 95%
PVL are shown in Table 4. Patients with horizocardia had a CI: −0.80 – −0.30; p<0.001) (Table 5).
higher risk of PVL (OR: 1.24; 95% CI: 1.16 – 1.33; p<0.001). 4. Discussion
As expected, additional risk factors included 3DP (OR: 0.18;
95% CI: 0.07 – 0.48; p=0.001), a larger coaxial angle (OR: This is the first large-scale study of transapical TAVR using
4.28; 95% CI: 3.06 – 6.00; p<0.001), and a higher coaxiality the J-Valve in patients with pure AR. The main findings
index (OR: 9.45; 95% CI: 4.40 – 20.28; p<0.001). The PVL are (i) transapical TAVR using the J-Valve is feasible for
Volume 11 Issue 4 (2025) 56 doi: 10.36922/jctr.24.00084