
Page 59 - JCTR-11-4
P. 59
Journal of Clinical and
Translational Research AR-TAVR coaxiality assessment using 3DP
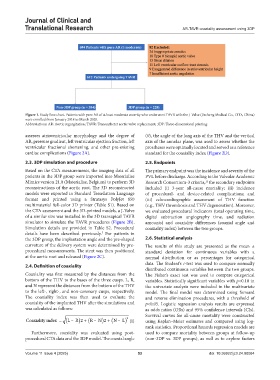
Figure 1. Study flow chart. Patients with pure AR of at least moderate severity who underwent TAVR with the J-Valve (Jiecheng Medical Co., LTD., China)
were enrolled from January 2018 to March 2020.
Abbreviations: AR: Aortic regurgitation; TAVR: Transcatheter aortic valve replacement; 3DP: Three-dimensional printing.
assesses atrioventricular morphology and the degree of (θ), the angle of the long axis of the THV and the vertical
AR, pressure gradient, left ventricular ejection fraction, left axis of the annular plane, was used to assess whether the
ventricular fractional shortening, and other pre-existing prostheses were optimally located and served as a reference
cardiac complications (Figure 2A). standard for the coaxiality index (Figure 2D).
2.3. 3DP simulation and procedure 2.5. Endpoints
Based on the CTA measurements, the imaging data of all The primary endpoint was the incidence and severity of the
patients in the 3DP group were imported into Materialise PVL before discharge. According to the Valvular Academic
Mimics version 21.0 (Materialise, Belgium) to perform 3D Research Consortium-3 criteria, the secondary endpoints
12
reconstructions of the aortic root. The 3D reconstructed included (i) 3-year all-cause mortality; (ii) incidence
models were exported in Standard Tessellation Language of procedural- and device-related complications; and
format and printed using a Stratasys PolyJet 850 (iii) echocardiographic assessment of THV function
multimaterial full-color 3D printer (Table S1). Based on (e.g., THV thrombosis and THV degeneration). Moreover,
the CTA assessment and the 3D-printed models, a J-Valve we evaluated procedural indicators (total operating time,
of a similar size was installed in the 3D transapical TAVR digital subtraction angiography time, and radiation
simulator to simulate the TAVR procedures (Figure 2B). amounts) and coaxiality differences (coaxial angle and
Simulation details are provided in Table S2. Procedural coaxiality index) between the two groups.
details have been described previously. For patients in
7
the 3DP group, the implantation angle and the pre-shaped 2.6. Statistical analysis
curvature of the delivery system were determined by pre- The results of this study are presented as the mean ±
procedural measurements. The stent was then positioned standard deviation for continuous variables with a
at the aortic root and released (Figure 2C). normal distribution or as percentages for categorical
data. The Student’s t-test was used to compare normally
2.4. Definition of coaxiality
distributed continuous variables between the two groups.
Coaxiality was first measured by the distances from the The Fisher’s exact test was used to compare categorical
bottom of the THV to the bases of the three cusps. L, R, variables. Statistically significant variables with p<0.10 in
and N represent the distances from the bottom of the THV the univariate analysis were included in the multivariate
to the left-, right-, and non-coronary cusps, respectively. model. The final model was determined using forward
The coaxiality index was then used to evaluate the and reverse elimination procedures, with a threshold of
coaxiality of the implanted THV after the simulations and p<0.05. Logistic regression analysis results are expressed
was calculated as follows: as odds ratios (ORs) and 95% confidence intervals (CIs).
Survival curves for all-cause mortality were constructed
(
(
) +
Coaxiality index = (L – R 2 R – N 2 N – L ) 2 (I) using Kaplan–Meier estimates and compared using log-
) +
rank statistics. Proportional hazards regression models are
Furthermore, coaxiality was evaluated using post- used to compare mortality between groups at follow-up
procedural CTA data and the 3DP model. The coaxial angle (non-3DP vs. 3DP groups), as well as to explore factors
Volume 11 Issue 4 (2025) 53 doi: 10.36922/jctr.24.00084