
Page 61 - JCTR-11-4
P. 61
Journal of Clinical and
Translational Research AR-TAVR coaxiality assessment using 3DP
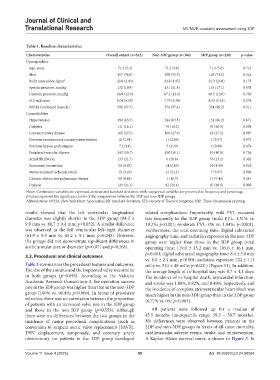
Table 1. Baseline characteristics
Characteristics Overall cohort (n=612) Non‑3DP group (n=384) 3DP group (n=228) p‑value
Demographics
Age, years 71.2 (5.3) 71.2 (5.6) 71.3 (5.0) 0.715
Men 453 (74.0) 290 (75.5) 163 (71.5) 0.316
Body mass index, kg/m 2 22.6 (2.03) 22.8 (1.97) 22.3 (2.08) 0.173
Systolic pressure, mmHg 132 (19.9) 131 (21.4) 133 (17.1) 0.478
Diastolic pressure, mmHg 66.9 (12.0) 67.2 (12.1) 66.5 (12.0) 0.750
STS risk score 8.04 (3.35) 7.75 (3.39) 8.33 (3.14) 0.274
NYHA functional class≥III 598 (97.7) 374 (97.4) 224 (98.2) 0.511
Comorbidities
Hypertension 390 (63.7) 244 (63.5) 151 (66.2) 0.671
Diabetes 111 (18.1) 70 (18.2) 47 (20.6) 0.598
Coronary artery disease 168 (27.5) 106 (27.6) 62 (27.2) 0.987
Previous percutaneous coronary intervention 18 (2.94) 11 (2.86) 7 (3.07) 0.973
Previous bypass graft surgery 7 (1.14) 5 (1.30) 2 (0.88) 0.476
Peripheral vascular disease 243 (39.7) 150 (39.1) 93 (40.8) 0.736
Atrial fibrillation 133 (21.7) 0 (20.8) 53 (23.2) 0.362
Permanent pacemaker 24 (3.92) 14 (3.65) 10 (4.39) 0.810
Stroke/transient ischemic attack 19 (3.10) 12 (3.12) 7 (3.07) 0.996
Chronic obstructive pulmonary disease 58 (9.48) 1 (10.7) 17 (7.46) 0.241
Dialysis 129 (21.1) 82 (21.4) 47 (20.6) 0.909
Notes: Continuous variables are expressed as mean and standard deviation, while categorical variables are presented as frequency and percentage.
p-values represent the significance levels of the comparisons between the 3DP and non-3DP groups.
Abbreviations: NYHA: New York Heart Association; SD: Standard deviation; STS: Society of Thoracic Surgeons; 3DP: Three-dimensional printing.
results showed that the left ventricular longitudinal related complications. Importantly, mild PVL occurred
diameter was slightly shorter in the 3DP group (84.2 ± less frequently in the 3DP group (mild PVL: 3.51% vs.
9.9 mm vs. 88.7 ± 9.4 mm; p=0.032). A similar difference 18.2%; p<0.001; moderate PVL: 0% vs. 1.04%; p<0.001).
was observed in the left ventricular left–right diameter Furthermore, the total operating time, digital subtracted
(61.9 ± 9.9 mm vs. 65.2 ± 9.1 mm; p=0.043). However, angiography time, and radiation exposure in the non-3DP
the groups did not demonstrate significant differences in group were higher than those in the 3DP group (total
aortic annular area or diameter (p=0.071 and p=0.266). operating time: 119.0 ± 15.2 min vs. 105.0 ± 16.1 min,
3.2. Procedural and clinical outcomes p<0.001; digital subtracted angiography time: 8.4 ± 3.0 min
vs. 6.0 ± 2.4 min, p<0.001; radiation exposure: 722 ± 113
Table 3 summarizes the procedural features and outcomes. mGy vs. 514 ± 48 mGy, p<0.001) (Figure S1). In addition,
The size of the annulus and the implanted valve was similar the average length of in-hospital stay was 8.7 ± 4.1 days.
in both groups (p=0.693). According to the Valvular The incidence of in-hospital death, myocardial infarction,
Academic Research Consortium-3, the operation success and stroke was 1.80%, 0.82%, and 0.49%, respectively, and
rate in the 3DP group was higher than that in the non-3DP the incidence of complete atrioventricular heart block was
group (100% vs. 96.4%; p=0.008). In terms of prosthesis much higher in the non-3DP group than in the 3DP group
selection, there was no correlation between the proportion (6.77% vs. 0%; p<0.001).
of patients with an increased valve size in the 3DP group
and those in the non-3DP group (p=0.553). Although All patients were followed up for a median of
there were no differences between the two groups in the 45.5 months (interquartile range: 39.2 – 50.7 months).
incidence of major procedural complications (such as No differences were observed between patients in the
conversion to surgical aortic valve replacement [SAVR], 3DP and non-3DP groups in terms of all-cause mortality,
THV displacement, tamponade, and coronary artery cardiovascular adverse events, stroke, and reintervention.
obstruction), no patients in the 3DP group developed A Kaplan–Meier survival curve is shown in Figure 3. In
Volume 11 Issue 4 (2025) 55 doi: 10.36922/jctr.24.00084