
Page 60 - JCTR-11-4
P. 60
Journal of Clinical and
Translational Research AR-TAVR coaxiality assessment using 3DP
A
B
C
D
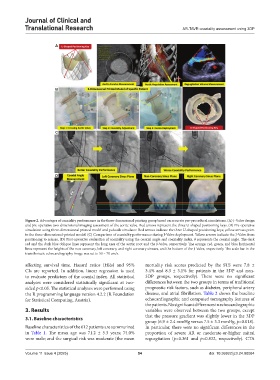
Figure 2. Advantages of coaxiality performance in the three-dimensional printing group based on accurate pre-procedural simulations. (A) J-Valve design
and pre-operative two-dimensional imaging assessment of the aortic valve. Red arrows represent the three U-shaped positioning keys. (B) Pre-operative
simulation using three-dimensional printed model and pulsatile simulator. Red arrows indicate the three U-shaped positioning keys; yellow arrows point
to the three-dimensional-printed model. (C) Comparison of coaxiality performance during J-Valve deployment. Yellow arrows indicate the J-Valve from
positioning to release. (D) Post-operative evaluation of coaxiality using the coaxial angle and coaxiality index. θ represents the coaxial angle. The dark
red and the dark blue oblique lines represent the long axes of the aortic root and the J-Valve, respectively. The orange, red, green, and blue horizontal
lines represent the heights of the non-coronary, left coronary, and right coronary sinuses, and the bottom of the J-Valve, respectively. The scale bar in the
transthoracic echocardiography image was set to 50 – 70 cm/s.
affecting survival time. Hazard ratios (HRs) and 95% mortality risk scores predicted by the STS were 7.8 ±
CIs are reported. In addition, linear regression is used 3.4% and 8.3 ± 3.1% for patients in the 3DP and non-
to evaluate predictors of the coaxial index. All statistical 3DP groups, respectively). There were no significant
analyses were considered statistically significant at two- differences between the two groups in terms of traditional
sided p<0.05. The statistical analyses were performed using prognostic risk factors, such as diabetes, peripheral artery
the R programming language version 4.2.2 (R Foundation disease, and atrial fibrillation. Table 2 shows the baseline
for Statistical Computing, Austria). echocardiographic and computed tomography features of
the patients. No significant differences in echocardiographic
3. Results variables were observed between the two groups, except
that the pressure gradient was slightly lower in the 3DP
3.1. Baseline characteristics
group (6.9 ± 2.4 mmHg versus 7.5 ± 3.3 mmHg, p=0.018).
Baseline characteristics of the 612 patients are summarized In particular, there were no significant differences in the
in Table 1. The mean age was 71.2 ± 5.3 years; 74.0% proportion of severe AR or moderate-or-higher mitral
were male; and the surgical risk was moderate (the mean regurgitation (p=0.361 and p=0.832, respectively). CTA
Volume 11 Issue 4 (2025) 54 doi: 10.36922/jctr.24.00084