
Page 39 - JCTR-9-6
P. 39
Asekenye et al. | Journal of Clinical and Translational Research 2023; 9(6): 398-413 403
Table 3. Vegetable collection time, preparation methods, quantity Table 4. Prevalence of hyperglycemia and distribution of participants’
served, and frequency of consumption characteristics
Character Category Sub‑region and Participant characteristics Category Hyperglycemia
frequency (%) prevalence
Ankole Teso (frequency %)
Collection time Morning 56.2 43.8 Sub-region Ankole 35.6
Afternoon 49.6 50.4 Tes Teso 19.5
Evening 96.2 3.8 Total 29.1
Preparation method Steaming 98.3 1.7 Age 19 – 30 20.4
Mixing with in stews or foods 90.3 9.7 31 – 45 29.0
Boiling 32.4 67.6 45 – 60 31.6
Frying 59.6 40.4 60 above 40.4
Pasting 0.0 100.0 Marital status Single 35.1
Quantity eaten 2 serving spoons 100.0 0.0 Married 27.2
3 serving spoons 79.4 20.6 Divorced 36.8
4 serving spoons 1.6 98.4 Widowed 38.7
5 serving spoons 0.0 100.0 Education level No formal education 25.8
Frequency of eating <3 88.9 11.1 Primary 28.0
(weekly) 3 – 5 64.9 35.1 Secondary 34.3
More than 5 32.4 67.6 Tertiary 27.3
Occupation Civil servant 16.7
most of the participants from Ankole sub-region ate vegetables for Farmer 28.1
<3 days whereas some from Teso sub-region ate them for more Non-civil servants 38.3
than 5 days. Years lived in resident sub-region 0 – 10 27.6
10 – 20 28.1
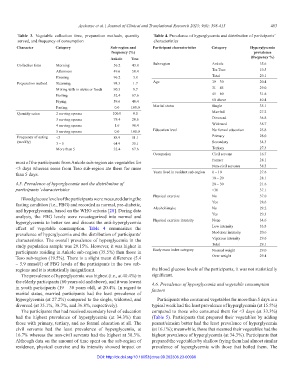
4.5. Prevalence of hyperglycemia and the distribution of 20 – 30 21.6
participants’ characteristics ≥30 37.1
Blood glucose levels of the participants were measured during the Physical exercise No 37.0
fasting condition (i.e., FBG) and recorded as normal, pre-diabetic, Yes 28.6
and hyperglycemia, based on the WHO criteria [28]. During data Alcohol intake No 29.2
analysis, the FBG levels were re-categorized into normal and Yes 29.3
hyperglycemia to better see and discuss the anti-hyperglycemia Physical exercise intensity None 34.6
effect of vegetable consumption. Table 4 summarizes the Low intensity 33.8
prevalence of hyperglycemia and the distribution of participants’ Moderate intensity 20.6
characteristics. The overall prevalence of hyperglycemia in the Vigorous intensity 29.6
study population sample was 29.15%. However, it was higher in Total 29.1
participants residing in Ankole sub-region (35.5%) than those in Body mass index category Normal weight 29.0
Teso sub-region (19.5%). There is a slight mean difference (5.4 Over weight 29.4
– 5.9 mmol/l) of FBG levels of the participants in the two sub-
regions and it is statistically insignificant. the blood glucose levels of the participants, it was not statistically
The prevalence of hyperglycemia was highest (i.e., at 40.4%) in significant.
the elderly participants (60 years old and above), and it was lowest 4.6. Prevalence of hyperglycemia and vegetable consumption
in youth participants (19 – 30 years old), at 20.4%. In regard to factors
marital status, married participants had the least prevalence of
hyperglycemia (at 27.2%) compared to the single, widowed, and Participants who consumed vegetables for more than 5 days in a
divorced (at 35.1%, 38.7%, and 36.8%, respectively). typical week had the least prevalence of hyperglycemia (at 15.5%)
The participants that had received secondary level of education compared to those who consumed them for <3 days (at 33.3%)
had the highest prevalence of hyperglycemia (at 34.3%) than (Table 5). Participants that prepared their vegetables by adding
those with primary, tertiary, and no formal education at all. The peanut/simsim butter had the least prevalence of hyperglycemia
civil servants had the least prevalence of hyperglycemia, at (at 16.1%); meanwhile, those that steamed their vegetables had the
16.7% whereas the non-civil servants had the highest at 38.3%. highest prevalence of hyperglycemia (at 34.3%). Participants that
Although data on the amount of time spent on the sub-region of prepared the vegetables by shallow frying them had almost similar
residence, physical exercise and its intensity showed impact on prevalence of hyperglycemia with those that boiled them. The
DOI: http://dx.doi.org/10.18053/jctres.09.202306.23-00096