
Page 41 - JCTR-9-6
P. 41
Asekenye et al. | Journal of Clinical and Translational Research 2023; 9(6): 398-413 405
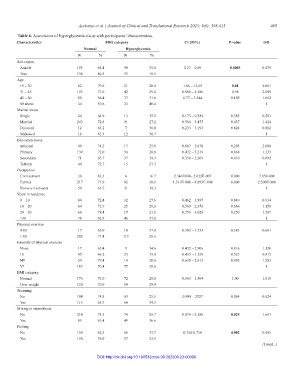
Table 6. Association of hyperglycemia status with participants’ characteristics.
Characteristics FBG category CI (95%) P‑value OR
Normal Hyperglycemia
N % N %
Sub-region
Ankole 163 64.4 90 35.6 0.27 – 0.69 0.0003 0.439
Teso 136 80.5 33 19.5
Age
19 – 30 82 79.6 21 20.4 1.86 – 12.69 0.01 4.861
31 – 45 103 71.0 42 29.0 0.880 – 4.586 0.98 2.009
45 – 60 80 68.4 37 31.6 0.77 – 3.544 0.189 1.662
60 above 34 59.6 23 40.4 1
Marital status
Single 24 64.9 13 35.1 0.173 – 0.584 0.385 0.583
Married 243 72.8 91 27.2 0.584 – 3.475 0.437 1.424
Divorced 12 63.2 7 36.8 0.233 – 3.193 0.824 0.862
Widowed 19 61.3 12 38.7 1
Education status
Informal 49 74.2 17 25.8 0.687 – 5.878 0.203 2.009
Primary 139 72.0 54 28.0 0.472 – 3.219 0.668 1.233
Secondary 71 65.7 37 34.3 0.350 – 2.269 0.810 0.892
Tertiary 40 72.7 15 27.3 1
Occupation
Civil servant 30 83.3 6 16.7 2.340E008– 2.625E-007 0.000 7.839-008
Farmer 217 71.9 85 28.1 1.331E-008 – 4.695E-008 0.000 2.500E-008
Non-civil servants 50 61.7 31 38.3 1
Years in residence
0 – 10 84 72.4 32 27.6 0.462 – 1.887 0.849 0.934
10 – 20 64 71.9 25 28.1 0.569 – 2.356 0.686 1.158
20 – 30 69 78.4 19 21.6 0.750 – 3.029 0.250 1.507
>30 78 62.9 46 37.1 1
Physical exercise
0.00 17 63.0 10 37.0 0.303 – 1.533 0.383 0.681
1.00 282 71.4 113 28.6
Intensity of physical exercise
None 17 65.4 9 34.6 0.432 – 2.906 0.816 1.120
LI 45 66.2 23 33.8 0.435 – 1.529 0.525 0.815
MI 54 79.4 14 20.6 0.630 – 2.615 0.492 1.283
VI 183 70.4 77 29.6 1
BMI category
Normal 176 71.0 72 29.0 0.663 – 1.564 1.00 1.019
Over weight 120 70.6 50 29.4
Steaming
No 184 74.5 63 25.5 0.998 – 2327 0.064 0.524
Yes 115 65.7 60 34.3
Mixing in stews/foods
No 214 74.3 74 25.7 0.074 – 2.588 0.029 1.667
Yes 85 63.4 49 36.6
Boiling
No 109 62.3 66 37.7 0.324-0.758 0.002 0.495
Yes 190 76.9 57 23.1
(Contd...)
DOI: http://dx.doi.org/10.18053/jctres.09.202306.23-00096