
Page 53 - JCTR-9-6
P. 53
Mustahsan et al. | Journal of Clinical and Translational Research 2023; 9(6): 414-422 417
2.4. Extraction and post-operative testing test at a significance level of 0.0083 (Bonferroni correction) was
performed to compare the different strength characteristics of the
After 3 weeks, the mice were euthanized with a lethal dose various scaffolds.
of isoflurane, and the scaffolds were extracted for post-operative Post-compression tests, scanning electron microscopy (SEM)
mechanical and staining studies. The scaffolds extracted from imaging (10.0 K × magnification at electron high-tension voltage
the animals were fixed in 4% formaldehyde solution for 24 h of 3.0 kV) was performed to observe the surface of the different
and washed and stored in DPBS for post-operative studies. The groups of scaffolds. Thereafter, staining studies with 2% Alizarin
previous studies have shown that pre-coating the BGS with CRFP red to validate calcium deposits and Von Kossa staining to validate
leads to enhanced osteoinduction which results in the deposition mineralization on the BGS surface were conducted. The Alizarin
of more bone matrix, contributing to improving the load-bearing red-stained scaffolds were imaged using a confocal microscope
capacity, that is, the compressive strength of the BGS. Therefore, (LSM-510; Zeiss, Oberkochen, Germany). We followed up
we performed unconstrained mechanical compressive testing these studies with histological studies using Nuclear Fast Red
(MTEST Quattro, Admet, Norwood, MA, USA) on four sets (Kernechtrot) staining for calcium and were imaged using a
of MED610 scaffolds (Table 1). For this purpose, the force was
applied in the direction of the axis of the scaffold, as illustrated in confocal microscope (upright DM 6000; Leica Microsystems,
Figure 3B. The speed of compression was set to 5 mm/min based on Wetzlar, Germany). In these staining studies, ten regions of
the ISO 604, international standards for plastics [47]. Stiffness (k), interest (ROI) (0.7 mm × 0.7 mm) were identified for analysis
maximum compressive strength (σ ), and compressive modulus in each image of the stained scaffold. For Alizarin red staining
M
(E ) in the central axis were evaluated. Thereafter, Shapiro–Wilk and Nuclear Fast Red staining, each ROI image was processed
C
test was carried out for the compressive test results of each type to isolate the red-colored pixel intensity map from the Red-Blue-
of scaffold to assess the normality of the data before carrying out Green (RGB) color image. This red color intensity map then is
the statistical analysis. A one-way analysis of variance (ANOVA) normalized such that “0” is the least red (100% white) and “1” is
the value for the highest red value (100% red). Then, the average of
this normalized intensity pixel map was calculated to represent the
Table 1. Types of MED610 scaffolds.
Type Protocol measure of the red intensity of the ROI. The higher red intensity
measure indicates more red spots on the ROI (representing higher
A Untreated scaffolds deposition of calcium deposits). In the case of Von Kossa staining,
B Decellularized scaffolds the RGB color image was converted to a grayscale image and
C Implanted untreated scaffolds normalize the grayscale image such that the “0” value refers to the
D Implanted decellularized scaffolds brightest pixel (100% white) and “1” value refers to the darkest
A B
C
D E
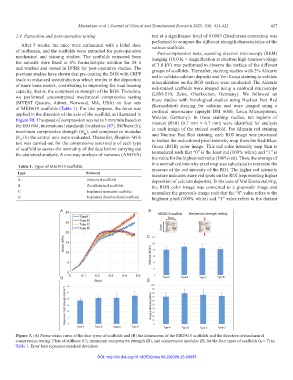
Figure 3. (A) Stress-strain curve of the four types of scaffolds and (B) the dimensions of the MED610 scaffolds and the direction of mechanical
compression testing. Plots of stiffness (C), maximum compressive strength (D), and compressive modulus (E) for the four types of scaffolds (n = 7) in
Table 1. Error bars represent standard deviation.
DOI: http://dx.doi.org/10.18053/jctres.09.202306.23-00097