
Page 54 - JCTR-9-6
P. 54
418 Mustahsan et al. | Journal of Clinical and Translational Research 2023; 9(6): 414-422
pixel (100% black). The darker spots on the image represent the matrix in the type B scaffolds, in comparison to type A scaffolds.
higher mineralization deposition on the ROI. One-way ANOVA When these scaffolds are implanted, type D scaffolds show
analysis at a significance level of 0.0083 (Bonferroni Correction) more deposition of organic material, indicating a higher level of
was performed to compare unseeded scaffolds with decellularized biointegration in comparison to type C scaffolds.
scaffolds. For the Alizarin red staining study for validating calcium
deposits on the scaffolds’ surfaces, the one-way ANOVA analysis
3. Results
showed a significant increase in calcium deposits from type A
3.1. Mechanical testing for the strength of the scaffolds (untreated scaffolds) to implanted scaffolds, that is, Type C
(P = 0.005) and Type D (P = 0.0027). All other comparisons
In the implantation study, the animals did not show any signs of between scaffolds were not statistically significant. These results
infection or prolonged distress due to implantation throughout the are represented in Figure 5A.
duration of the study, and by the 10 day, they were able to regain For the Von Kossa staining study to validate mineralization
th
complete range of motion and were able to walk/run without any on the surface of the scaffolds, the one-way ANOVA analysis
signs of pain or distress. All animals maintained their weight by showed that Type B and Type D (demineralized) scaffolds
the end of the study and did not trigger any exclusion criteria. showed a significantly higher mineralization on the scaffold
In the mechanical testing of the four types of scaffolds listed in
Table 1, the data followed normal distribution using Shapiro–Wilk surface compared to Type A and Type C (untreated) scaffolds
test. Thereafter, the one-way ANOVA test showed no significant (P < 0.001 for all significant comparisons). The comparisons are
difference in stiffness (k), maximum compressive strength illustrated in Figure 5B. The confocal microscopy results with
(σ ), and compressive modulus (E ). However, on plotting Nuclear Fast Red staining shows a significantly higher calcium
M
C
the stress-strain data shown in Figure 3A from the stress-strain deposition in demineralized scaffolds (Types B and D) compared
curves, it was noted that the decellularized scaffolds with bone to untreated scaffolds (Types A and C) in the one-way ANOVA
matrix (type B and D) show superior trends for maximum yield analysis (P < 0.001), as illustrated in Figure 6.
strength (σ ) in comparison to untreated scaffolds without bone 4. Discussion
M
matrix (type A and C). These findings follow our earlier reported
results [24]. The strength characteristics (k, σ and E ) of all In this study, we developed non-biodegradable BGS from
M,
C
types of scaffolds are illustrated in Figure 3. Stratasys MED610 material for testing the biocompatibility of
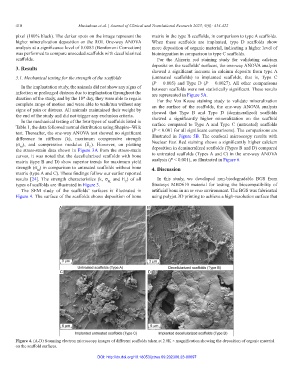
The SEM study of the scaffolds’ surfaces is illustrated in artificial bone in an in vivo environment. The BGS was fabricated
Figure 4. The surface of the scaffolds shows deposition of bone using polyjet 3D printing to achieve a high-resolution surface that
A B
C D
Figure 4. (A-D) Scanning electron microscopy images of different scaffolds taken at 2.0K × magnification showing the deposition of organic material
on the scaffold surfaces.
DOI: http://dx.doi.org/10.18053/jctres.09.202306.23-00097