
Page 35 - MI-1-1
P. 35
Microbes & Immunity The feature of bladder cancer stem cells
CIS and MIBC originate from BESCs. Furthermore, greater tumorgenicity compared to CD44 BC cells. In
-
gradient dilution transplantation experiments validated addition, CD44 BC cells could give rise to both CD44 and
-
+
the relationship between BCSCs and BESCs, with SHH + CD44 BC cells, suggesting that CD44 cells possess the
+
+
EpCAM cells displaying tumorigenic potential, unlike ability to differentiate and form heterogeneous tumors,
+
SHH EpCAM cells. Taken together, these observations consistent with the characteristics of BCSCs. 27
+
-
indicate that the SHH EpCAM cells exhibit traits of TSCs,
+
+
share SHH expression with BESCs, and imply a potential In bladder tissue, CK20 serves as a marker for highly
origin of BCSCs from BESCs. 51 differentiated urothelial cells, while CK5 is expressed
in less differentiated basal cells. Therefore, CK5 and
3.2. Biomarkers of BCSCs CK20 are considered indicative of the degree of cellular
differentiation. Building upon this hypothesis, Chan et al.
The potential origin of BCSCs from either BESCs or +
BCNSCs suggests that these cell types may share similarities, indicated that the molecular phenotype of CD44 BCSCs
+
+
-
including biomarkers. A profound understanding of the is CD44 /CK5 /CK20 , with a proportion of approximately
+
27
biological characteristics of BCSCs is crucial for their 30 – 40% in xenograft tumor cells. Furthermore, CD44
effective isolation. Reported markers for the identification BCSCs expressed CK5, resembling basal cells. Notably,
of BCSCs include CD44, CK5, ALDH1, OCT4, and the basal subtype or a high proportion of BCSCs was
CD44v6 (Table 1). The expression levels of these molecular correlated with a poor prognosis among BC patients. This
markers are related to the progression, invasiveness, and finding suggests that different pathological states of BC
prognosis of BC patients. may originate from bladder cells in various differentiation
states.
3.2.1. CD44 /CK5 /CK20 -
+
+
3.2.2. 67LR /CEACAM6 /CK17 +
+
-
CD44, a member of the adhesion molecule family, is
expressed on the cell surface and has been closely associated Researchers at Johns Hopkins University, led by He et al.,
with tumor progression and metastasis. It is commonly have identified several biomarkers associated with BCSCs.
52
used for diagnosing BC, as subsets of basal cells and BC Specifically, BCSCs were found to be positive for the 67
cells express CD44. To clarify the relationship between KD laminin receptor (67LR) and CK17 while negative
CD44 and the phenotype of BCSCs, Chan et al. conducted for CEACAM6. In addition, aberrant activation of the
an expression analysis of CD44 in 300 BC samples. They WNT pathway was observed in BCSCs, with significantly
observed that approximately 40% of the cells in these higher expression of WNT factors observed in 67LR high
+
samples were CD44 . Furthermore, they demonstrated in BC cells. This finding suggests that 67LR high BC cells
41
mouse models that CD44 BC cells exhibit 10 to 200 times may indeed represent BCSCs. Furthermore, they screened
+
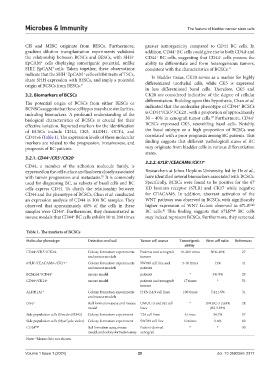
Table 1. The markers of BCSCs
Molecular phenotype Detection method Tumor cell source Tumorigenic Stem cell ratio References
ability
CD44 /CK5 /CK20- Colony formation experiments Patients and xenograft 10-200 times 30%-40% 27
+
+
and mouse models tumors
+
67LR /CEACAM6-/CK17 + Colony formation experiments SW780 cell line and 5-10 times 15% 41
and mouse models patients
BCMab1 /CD44 + mouse model patients * 3%-5% 29
+
CD90 /CK14 + mouse model patients and xenograft 17 times * 53
+
tumors
ALDH1A1 + Colony formation experiments HTB-2,4,9 cell lines 100 times 7.4±1.6% 31
and mouse models
OV6 + Ball formation assay and mouse UMUC-3 and J82 cell * UMUC-3 2.63% 28
model lines J82 3.23%
Side population cells (Hoechst33342) Colony formation experiment T24 cell lines 6 times 34.7% 57
Side population cells (DyeCycle violet) Colony formation experiment SW780 cell line 10 times 1.6% 60
CD24 high Ball formation assay, mouse Patient-derived * * 30
model, and colony formation assay xenograft
Note: *Means data not shown.
Volume 1 Issue 1 (2024) 29 doi: 10.36922/mi.2377